HVG selection diagnostics
The selection of highly variable genes is a crucial step in the integration process and in identifying clusters in single-cell experiments. However, contamination from ambient RNA can act as a significant confounding factor. This section of the report provides plots to evaluate the influence of ambient RNA on the selection of highly variable genes and its potential impact on downstream analyses.
Are highly variable genes “ambient” ?
The plot shows the extent to which highly variable genes identified
using the Seurat VST method may be influenced by ambient
RNA. The x-axis represents the log2fc values derived from
the ambient gene estimation step in scprocess (see
scprocess documentation for more details), while the y-axis
shows the trend-normalized variance calculated using the
Seurat VST method. Each point represents a gene, annotated
based on whether it is among the top HVGs and whether it is identified
as ambient by the ambient gene detection step. Labelled genes are top 10
most variable.
print(plot_hvg_stats_vs_empty_log2fc(cell_hvgs, edger_dt))![]()
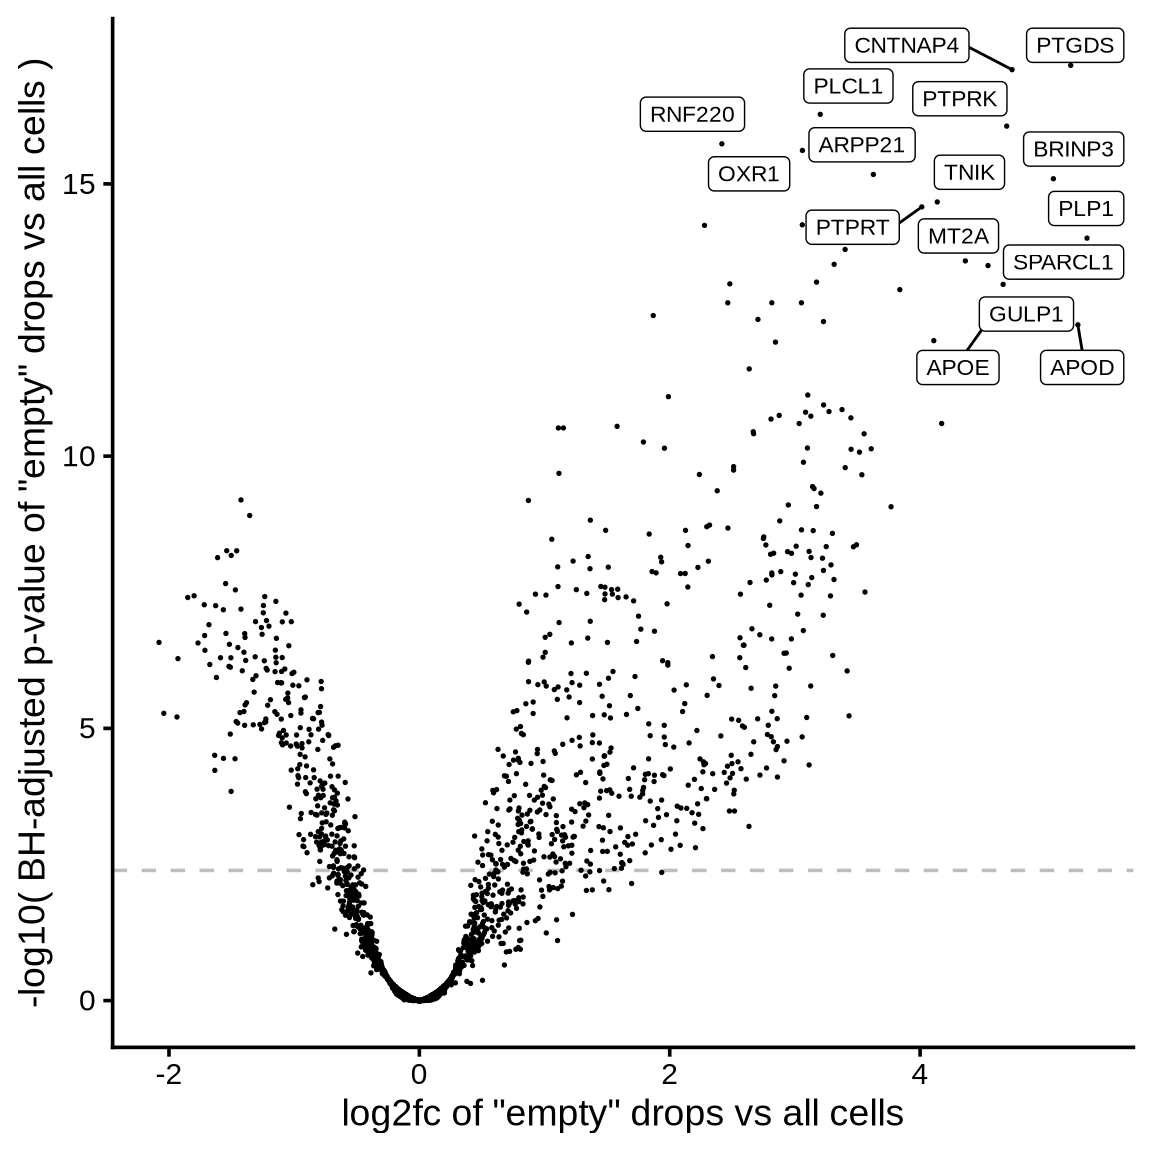
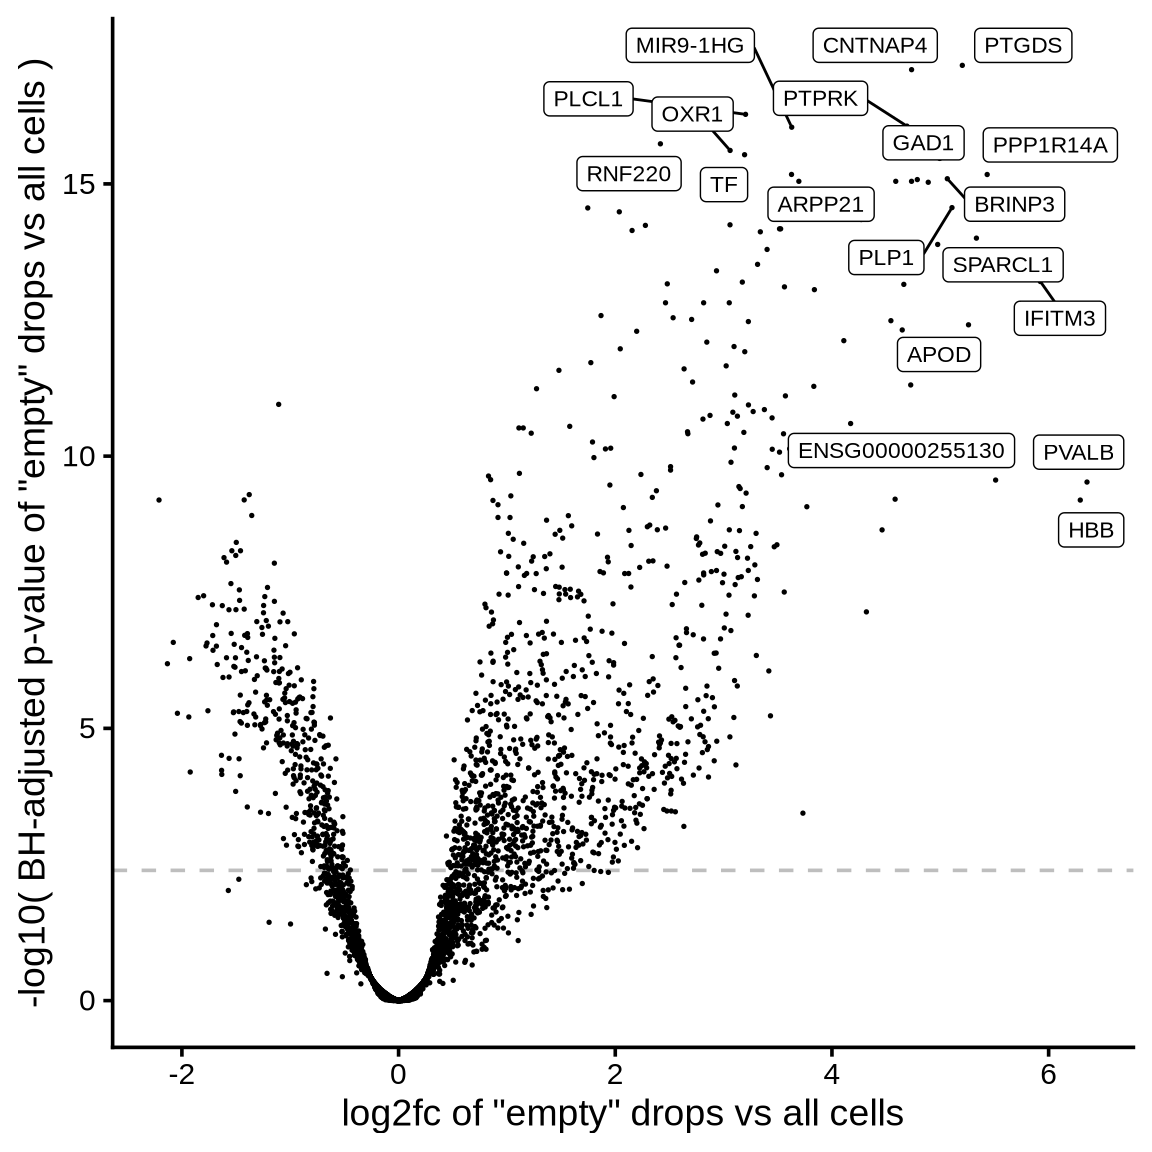
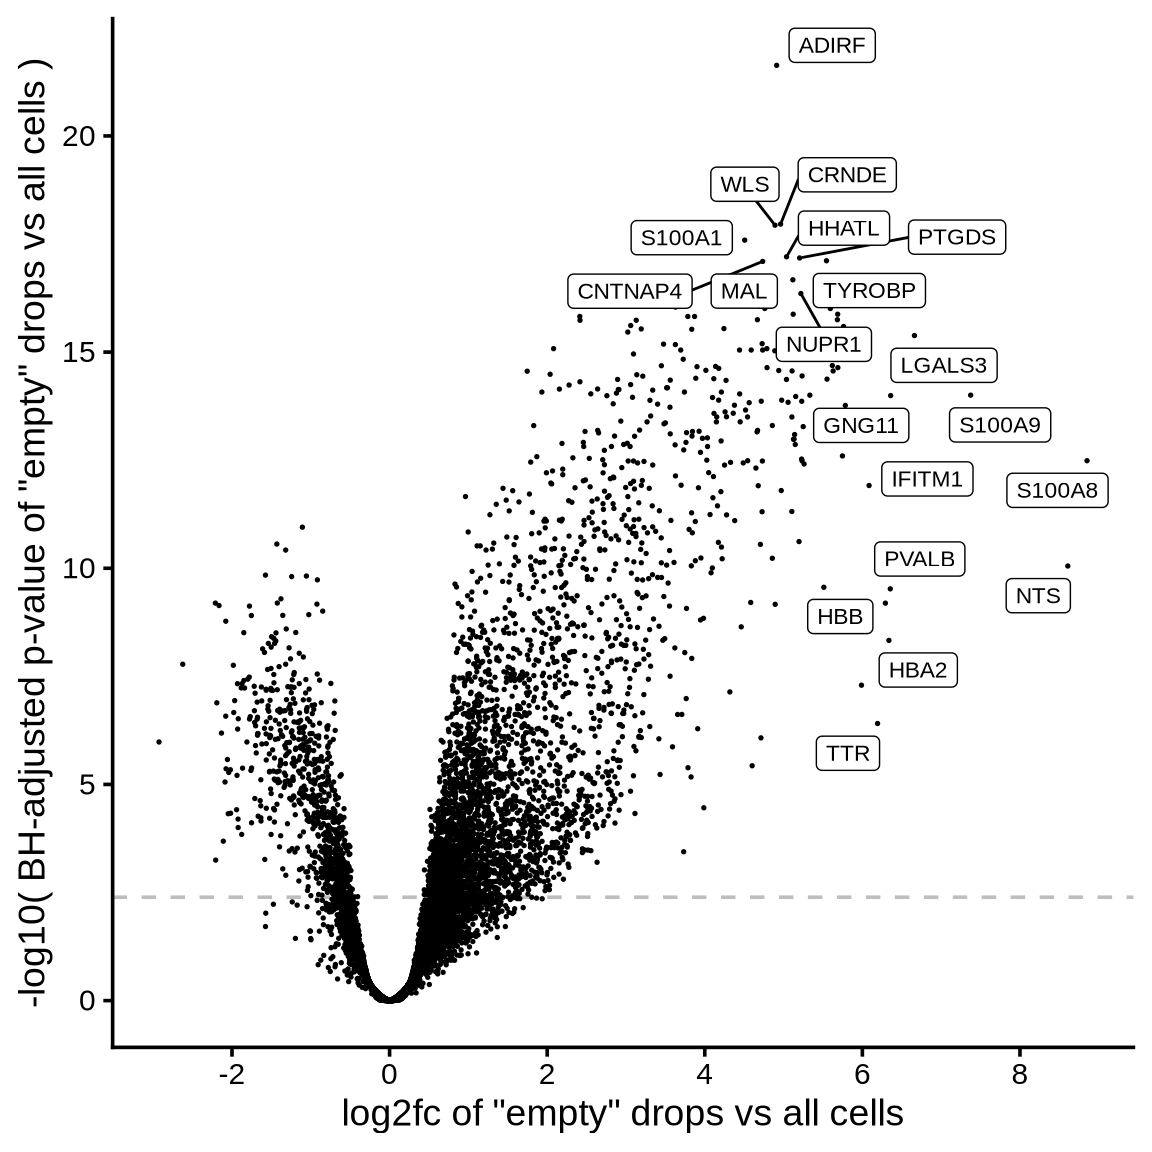
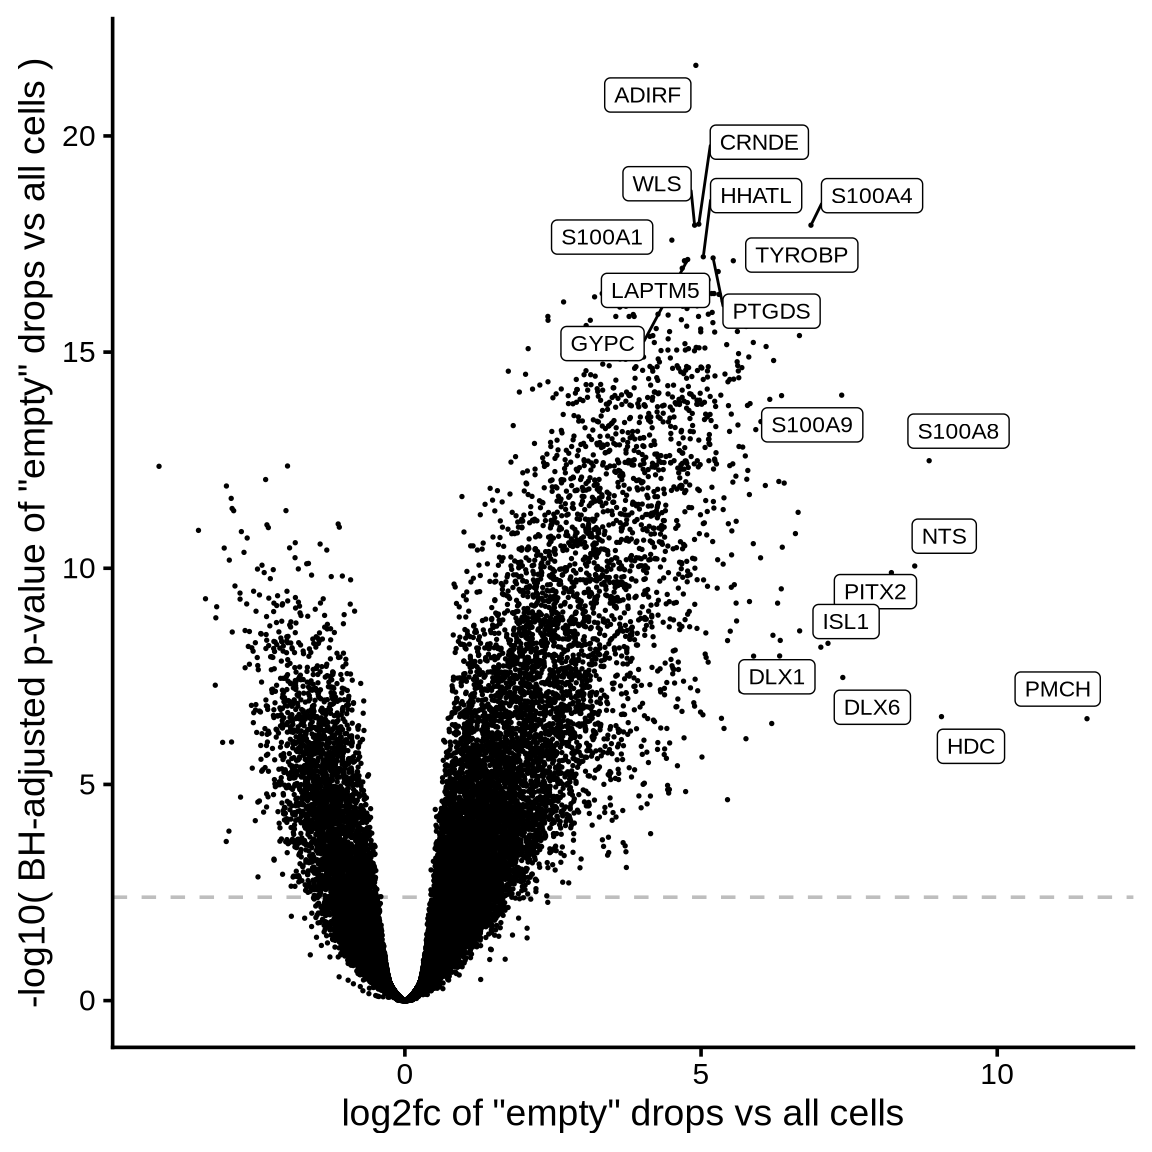
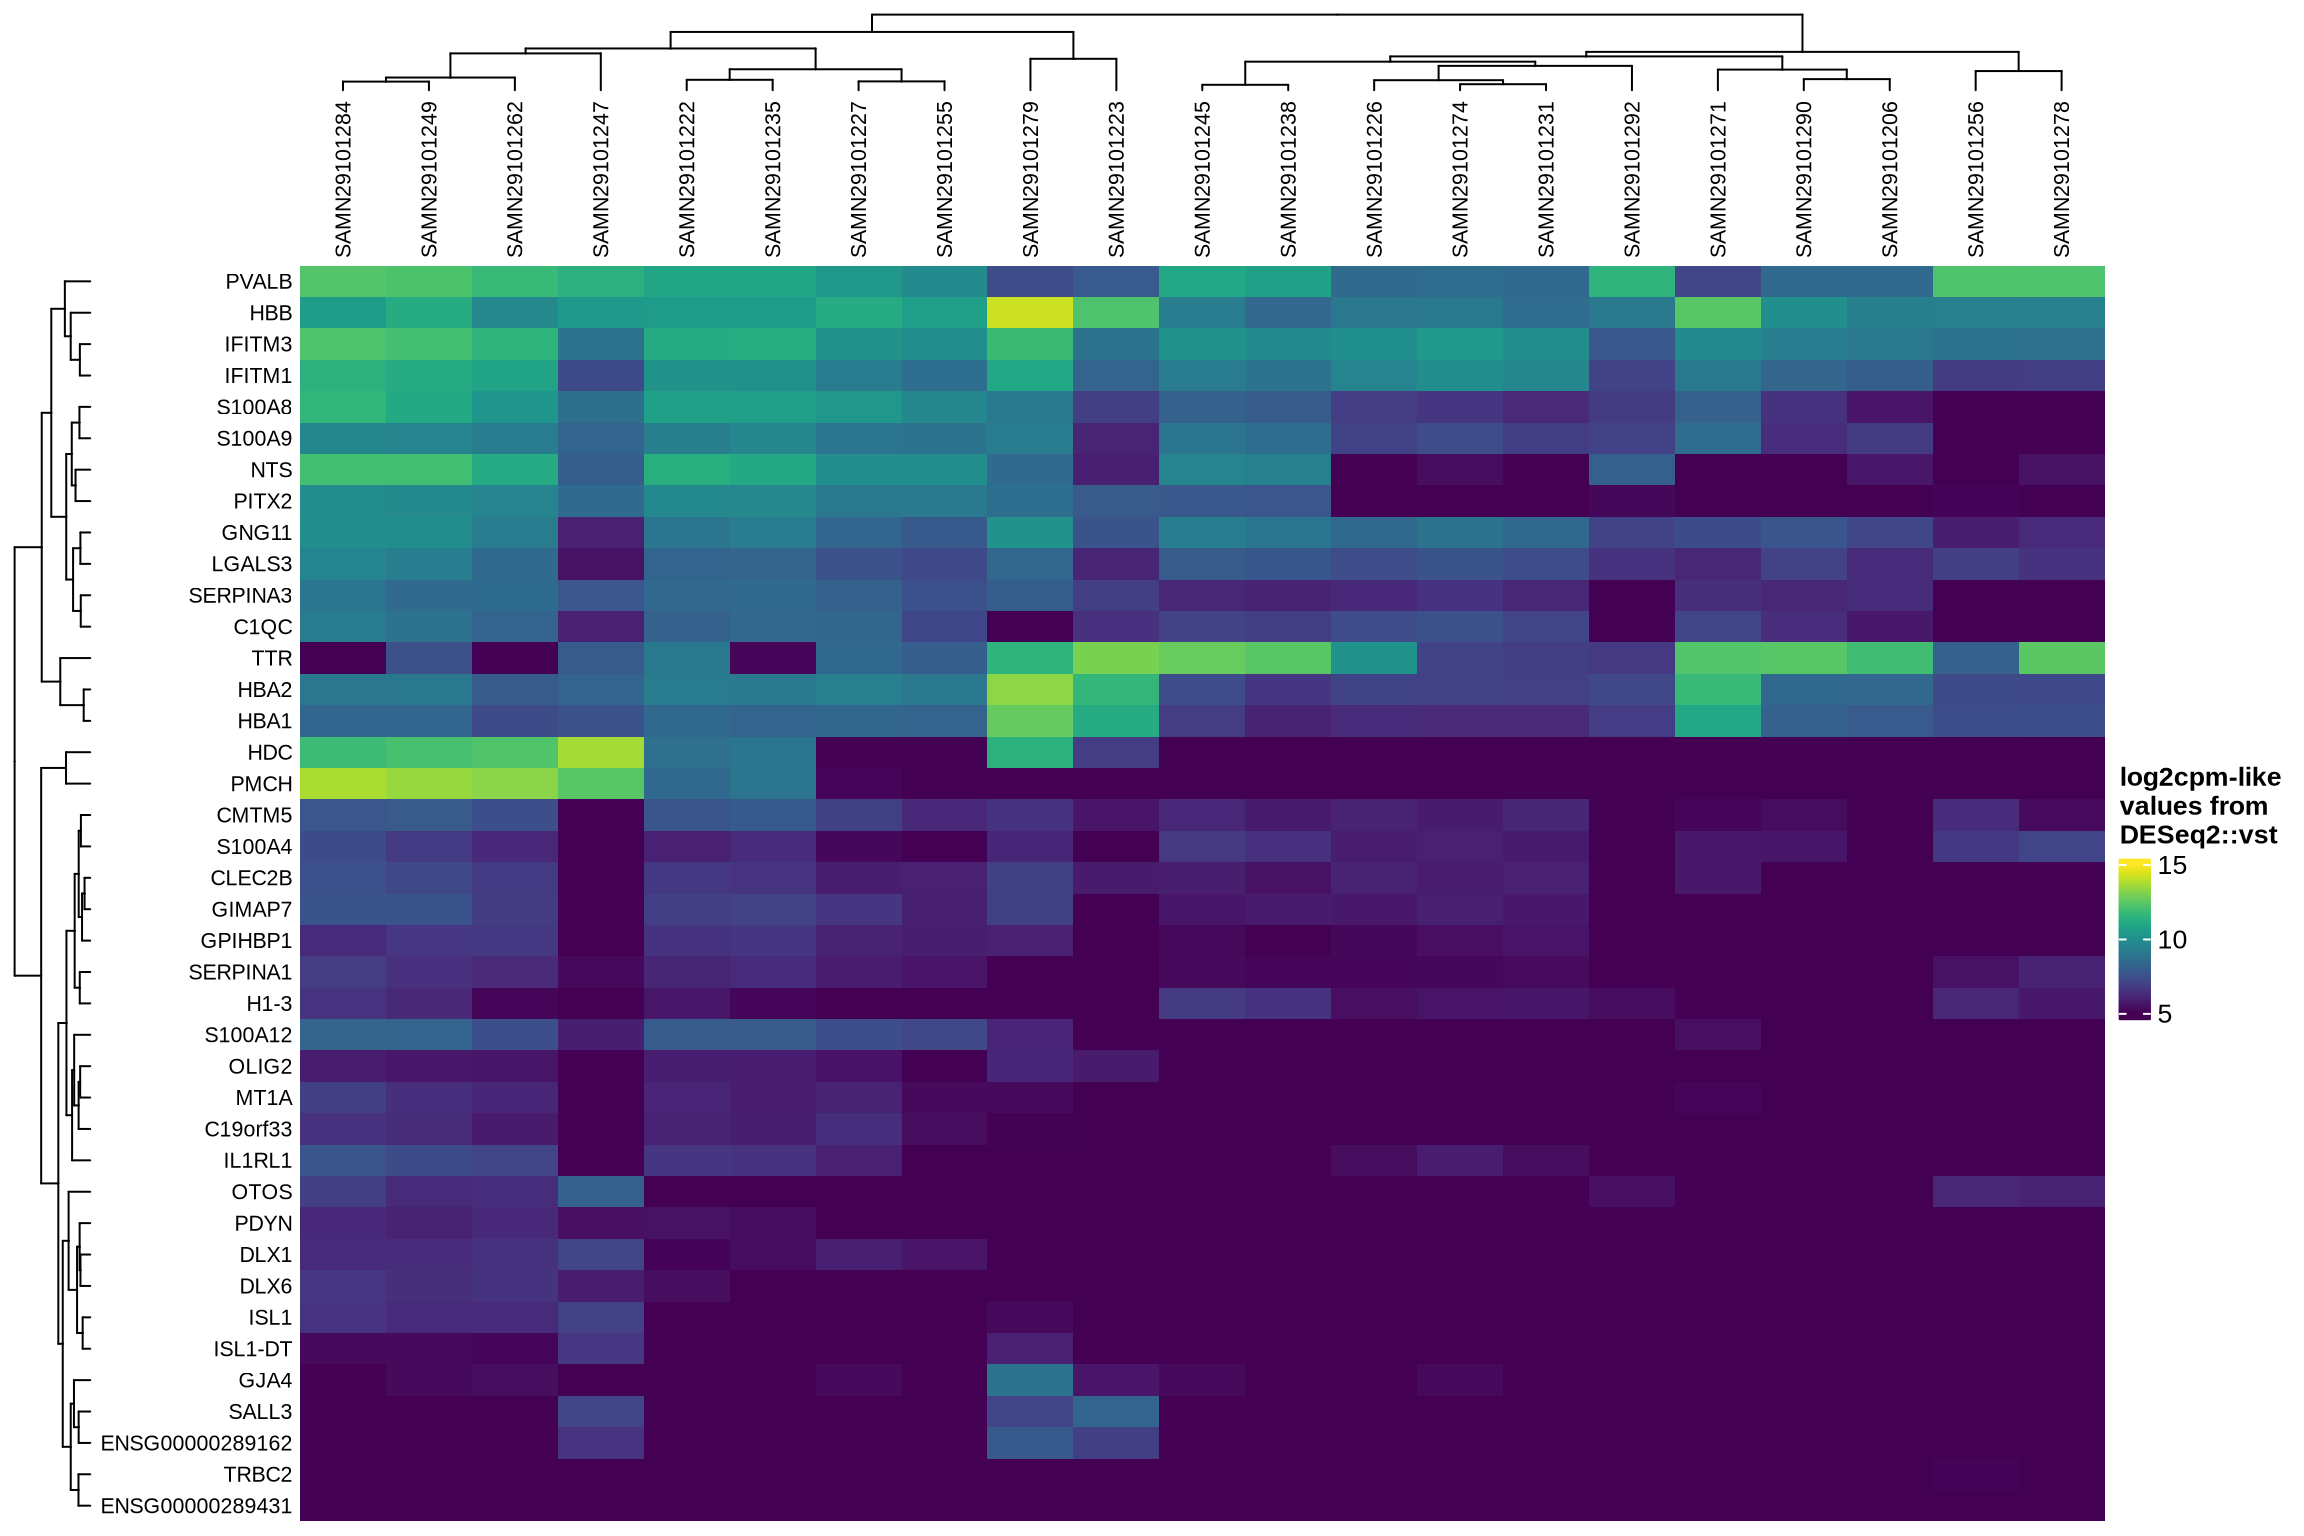
Which genes are “ambient”?
The plot shows the results of the scprocess ambient gene
detection procedure. The y-axis is the -log10 nominal
p-value, with a dotted line indicating the threshold where the adjusted
p-value is sufficiently small (< 0.01). Multiple plots are shown,
each corresponding to a different minimum expression level filter
applied to the ambient profiles.
cpm_ls  = c(100, 50, 10, 0)
for (min_cpm in cpm_ls) {
  if (min_cpm == 0) {
    cat("#### all genes\n")
  } else {
    cat(sprintf("#### >= %d CPM expression in ambient\n", min_cpm))
  }
  print(plot_ambient_gene_calculations(edger_dt, min_cpm_empty = min_cpm))
  cat("\n\n")
}
>= 100 CPM expression in ambient
>= 50 CPM expression in ambient
>= 10 CPM expression in ambient
all genes
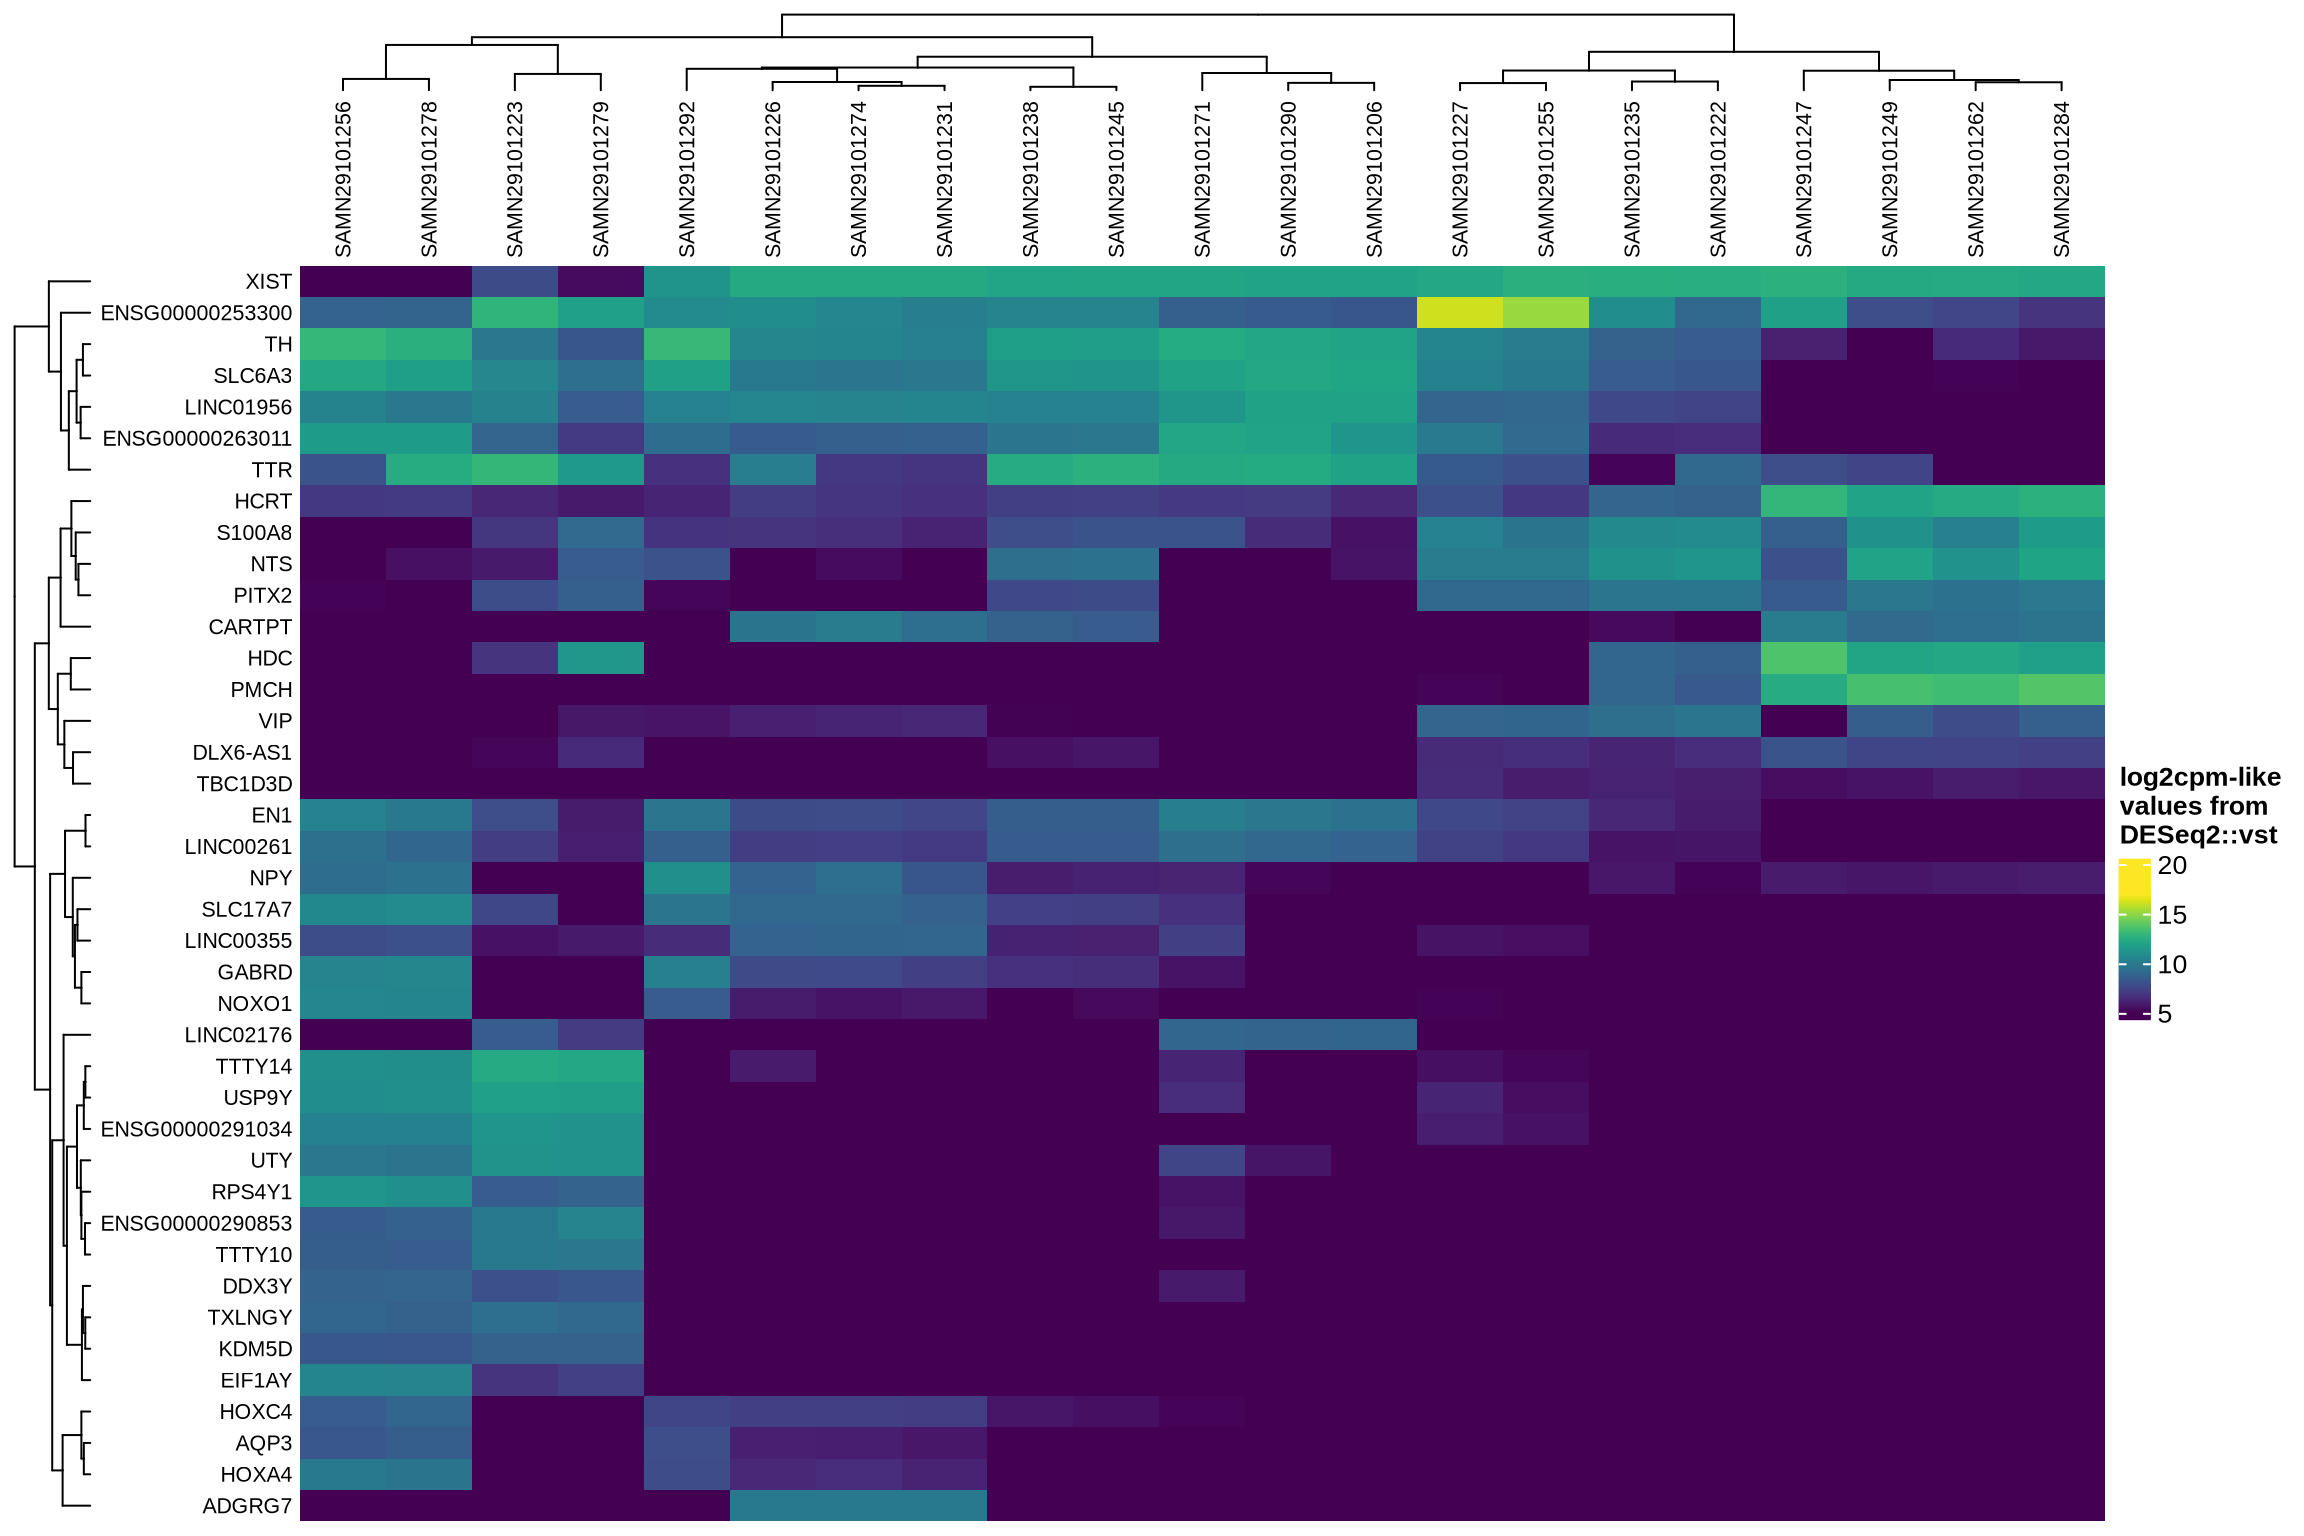
Which genes are variable across the ambient profiles?
Examining how ambient genes vary across different samples can provide valuable insights. Such variation may highlight cases where certain samples require distinct treatment, for example, if case and control samples consistently exhibit different ambient profiles.
The heatmaps display the pseudobulk expression of various genes across the ambient profiles of each sample in the dataset. The genes shown are the top 40 selected based on the following criteria:
- highest variance across ambient profiles;
- highest mean expression across ambient profiles;
- highest
log2fcin empty droplets vs cells inscprocess’s ambient gene detection procedure; and - smallest p-value in empty droplets vs cells in
scprocess’s ambient gene detection procedure.
title_ls = c(
  "var"           = "HVGs",
  "mean"          = "Highest expression",
  "log2fc.empty"  = "Highest log2fc",
  "pval.empty"    = "Smallest p-value"
)
for (top_var in names(title_ls)) {
  cat(sprintf("#### %s in ambient\n", title_ls[top_var]))
  suppressMessages(draw(plot_heatmap_of_ambient_profiles(vst_obj, top_var = top_var,
    n_top = 40), heatmap_legend_side = "right", merge_legend = TRUE ))
  cat("\n\n")
}
HVGs in ambient
Highest expression in ambient
Highest log2fc in ambient
Smallest p-value in ambient
Clustering diagnostics
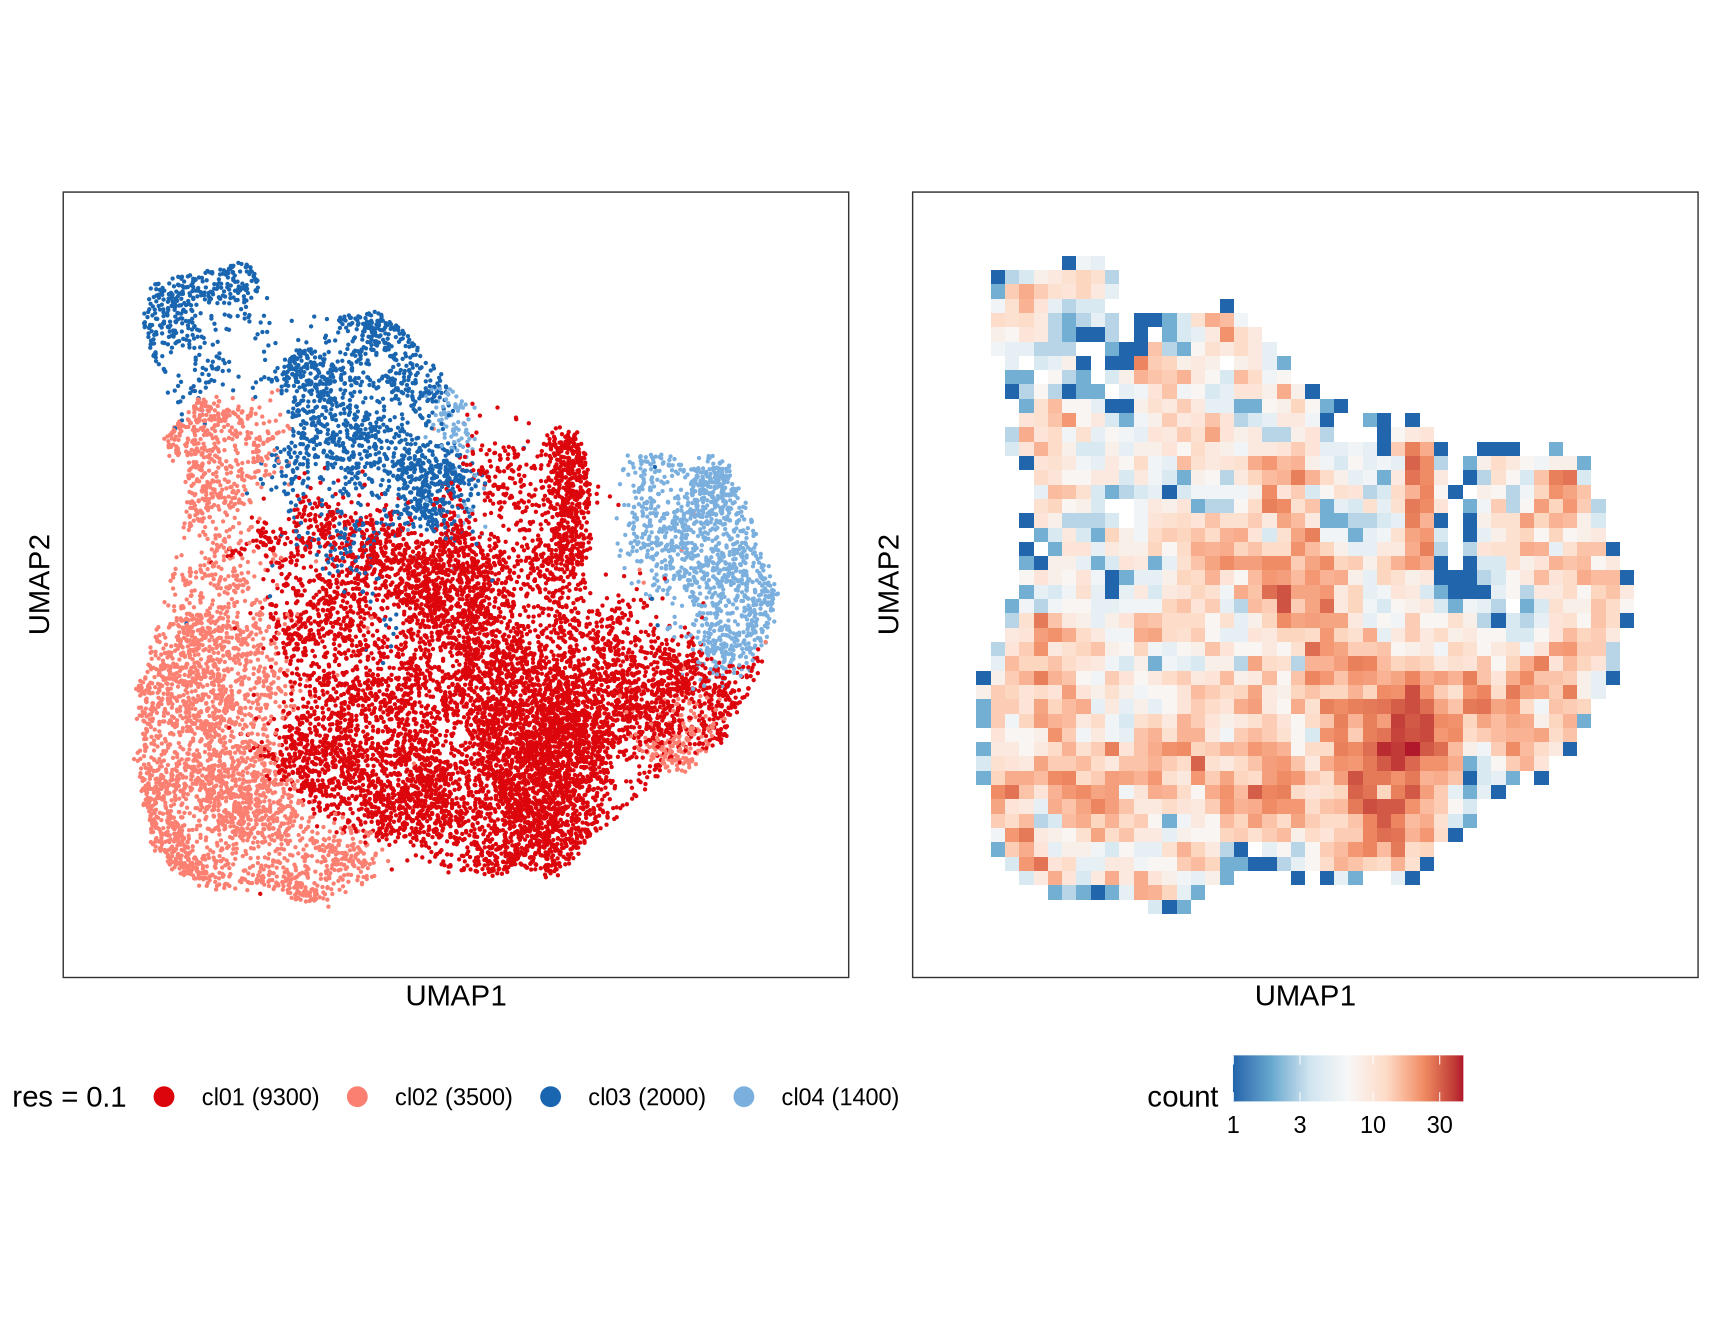
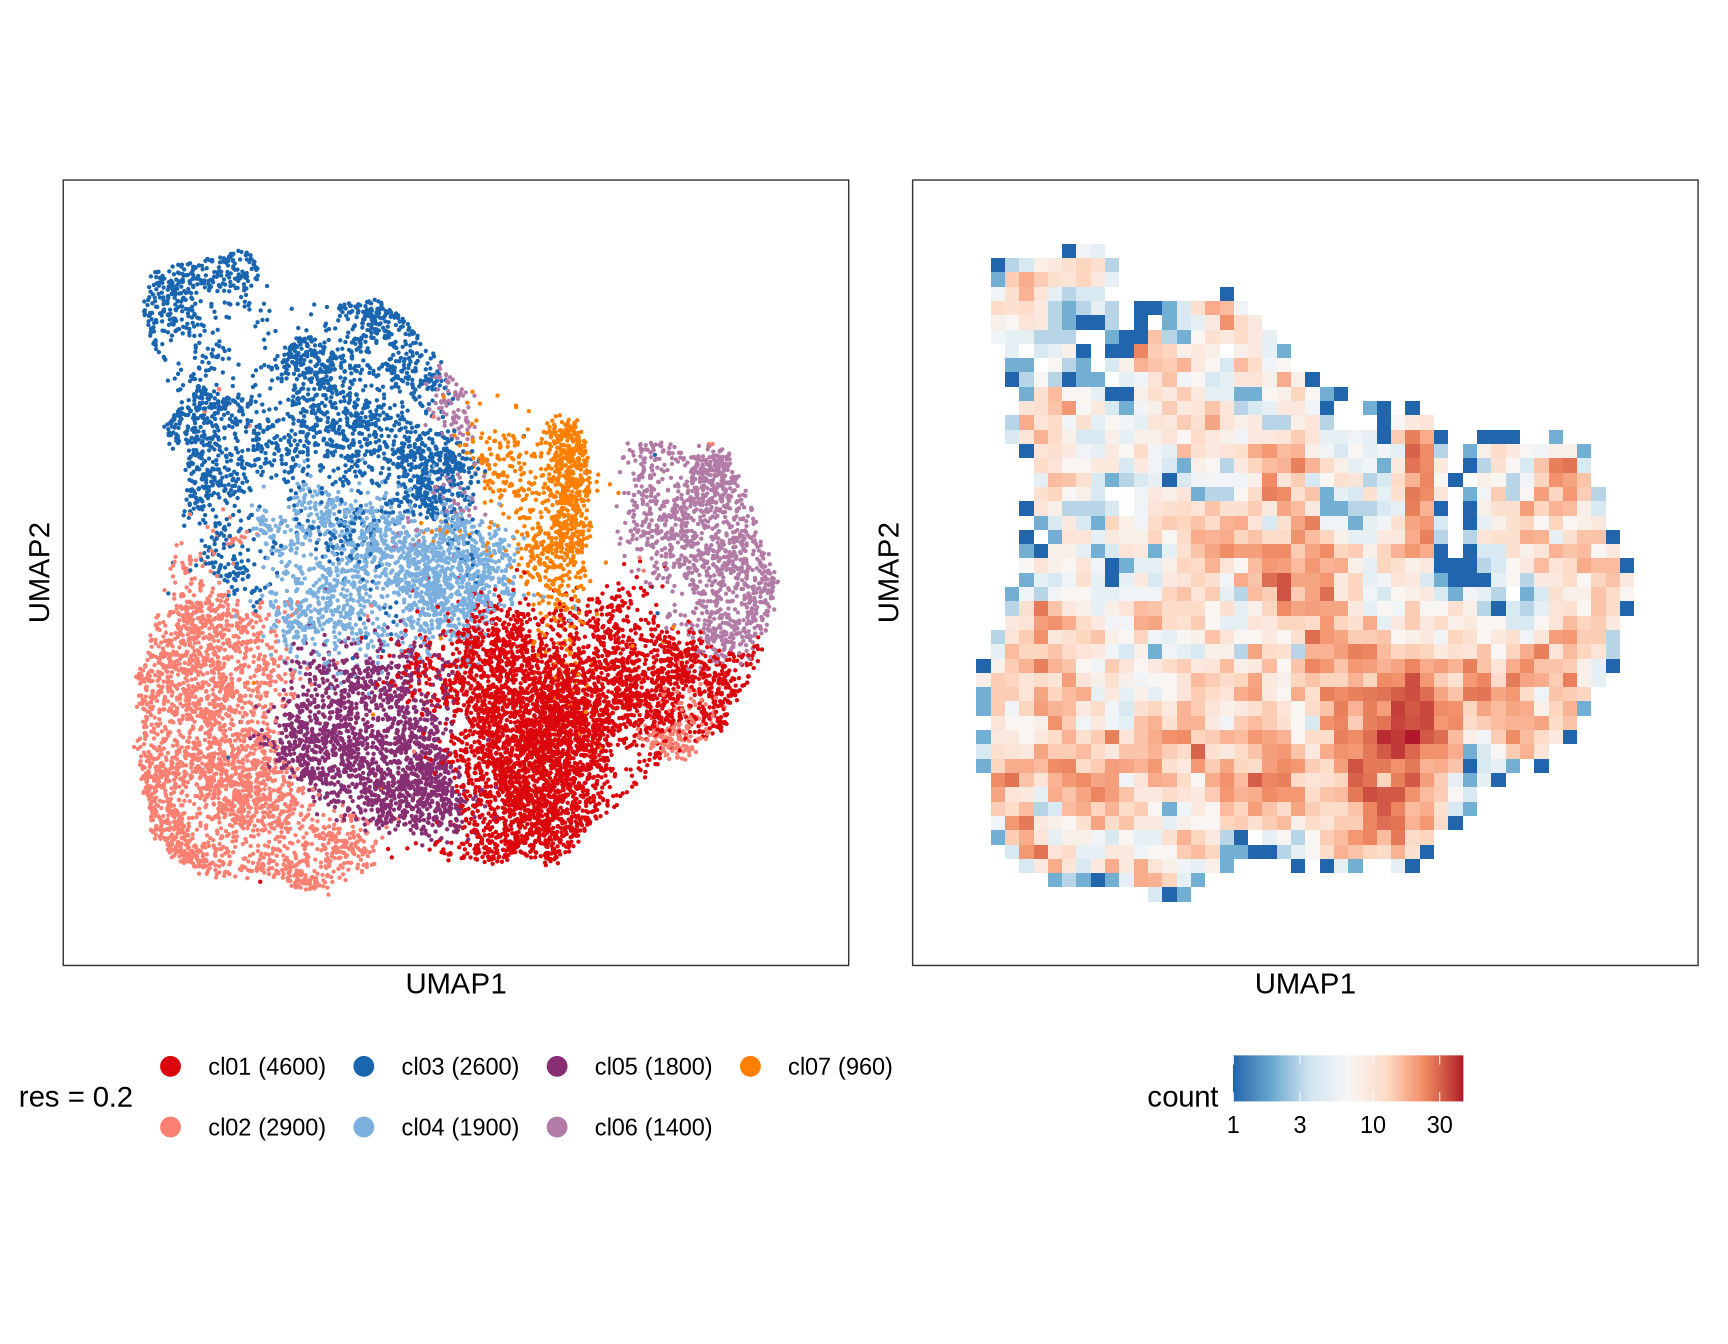
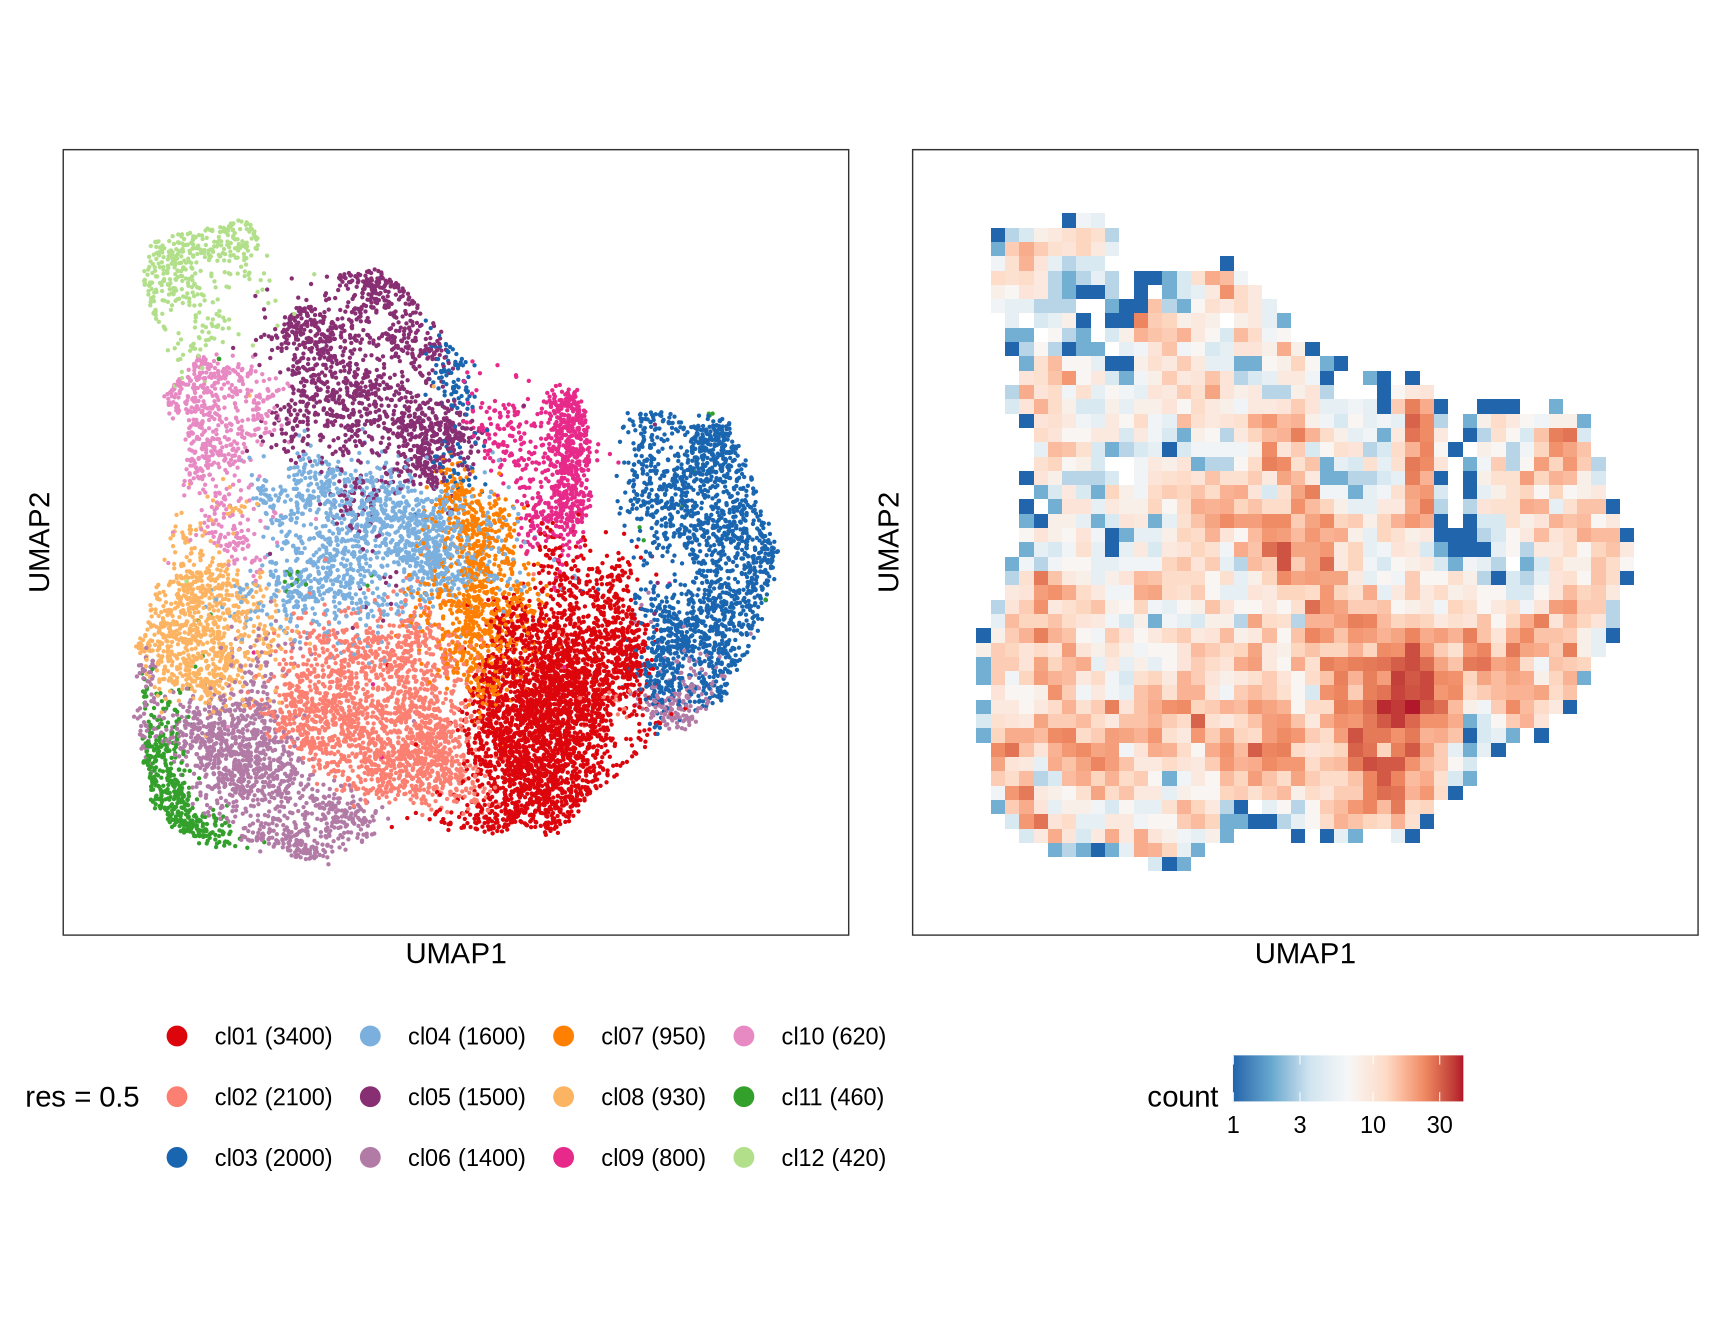
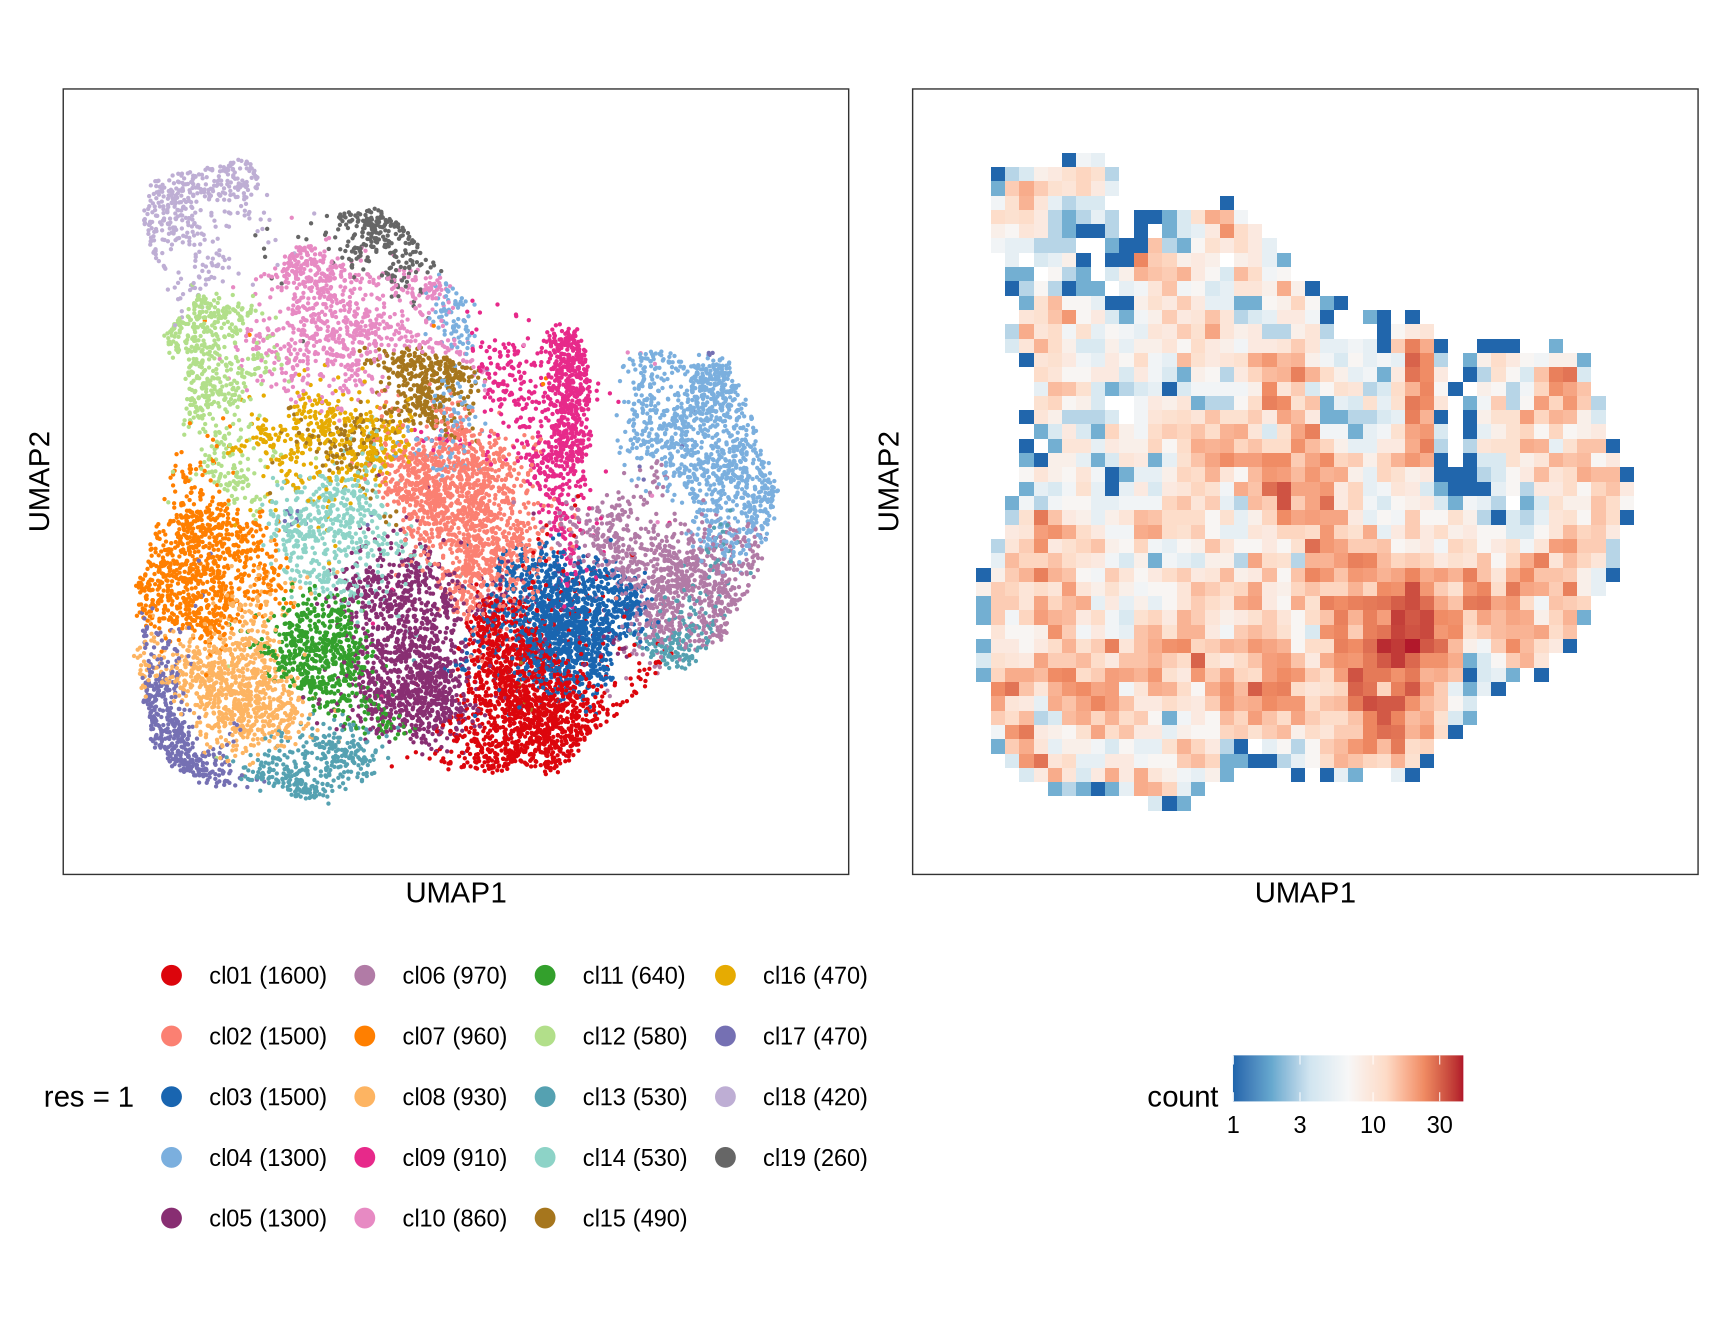
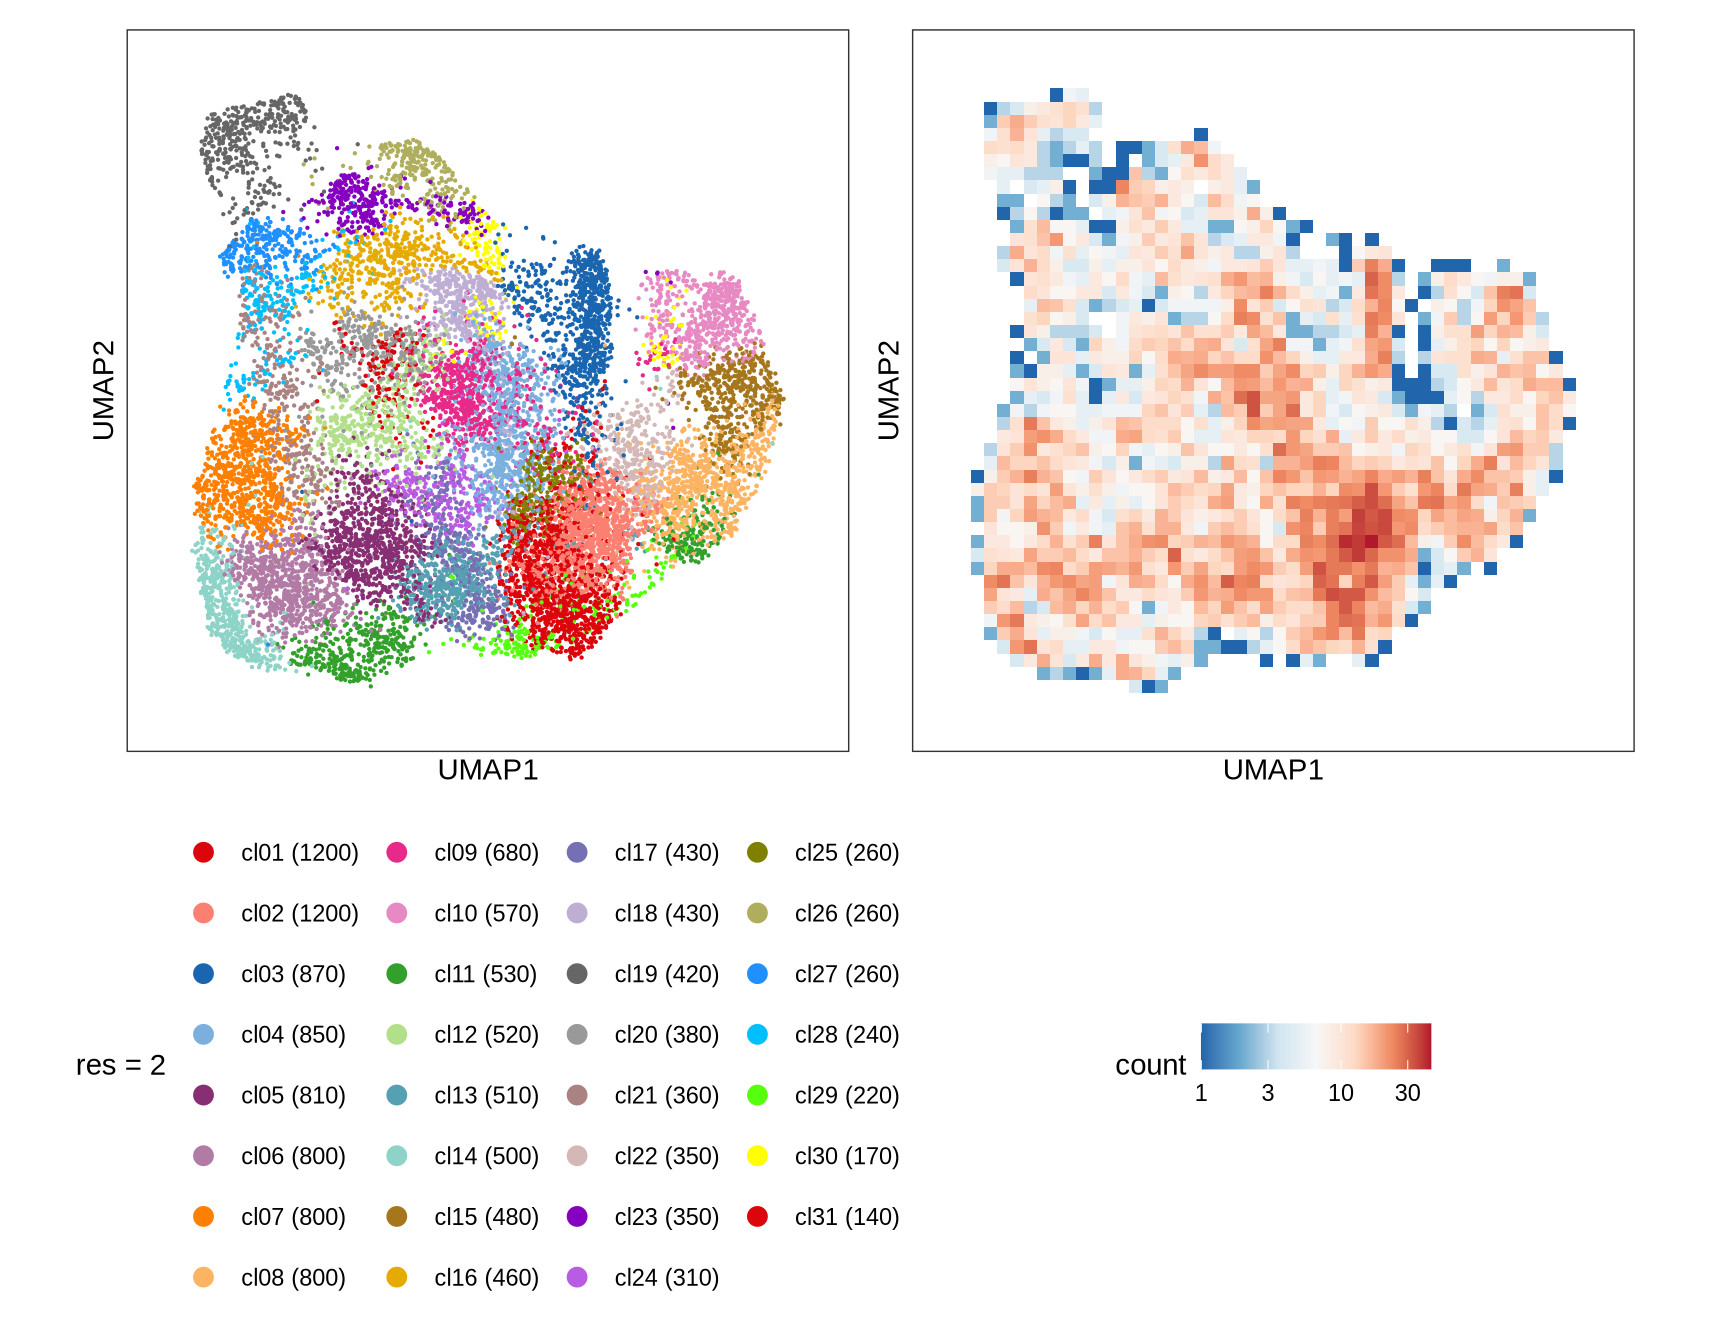
Clusters over UMAP
Clustering of data is performed at different resolution values. For each value the clusters are displayed over a UMAP together with a plot showing the density of cells.
for (res in res_ls) {
  cat('#### ', res, '\n')
  g_cl    = plot_umap_cluster(
    umap_dt   = int_dt[, .(cell_id, UMAP1, UMAP2) ],
    clust_dt  = int_dt[, .(cell_id, cluster = get(paste0('RNA_snn_res.', res))) ],
    name      = sprintf('res = %s', res))
  g_dens  = plot_umap_density(int_dt[, .(cell_id, UMAP1, UMAP2) ])
  g       = g_cl + g_dens
  print(g)
  cat('\n\n')
}
0.1
0.2
0.5
1
2
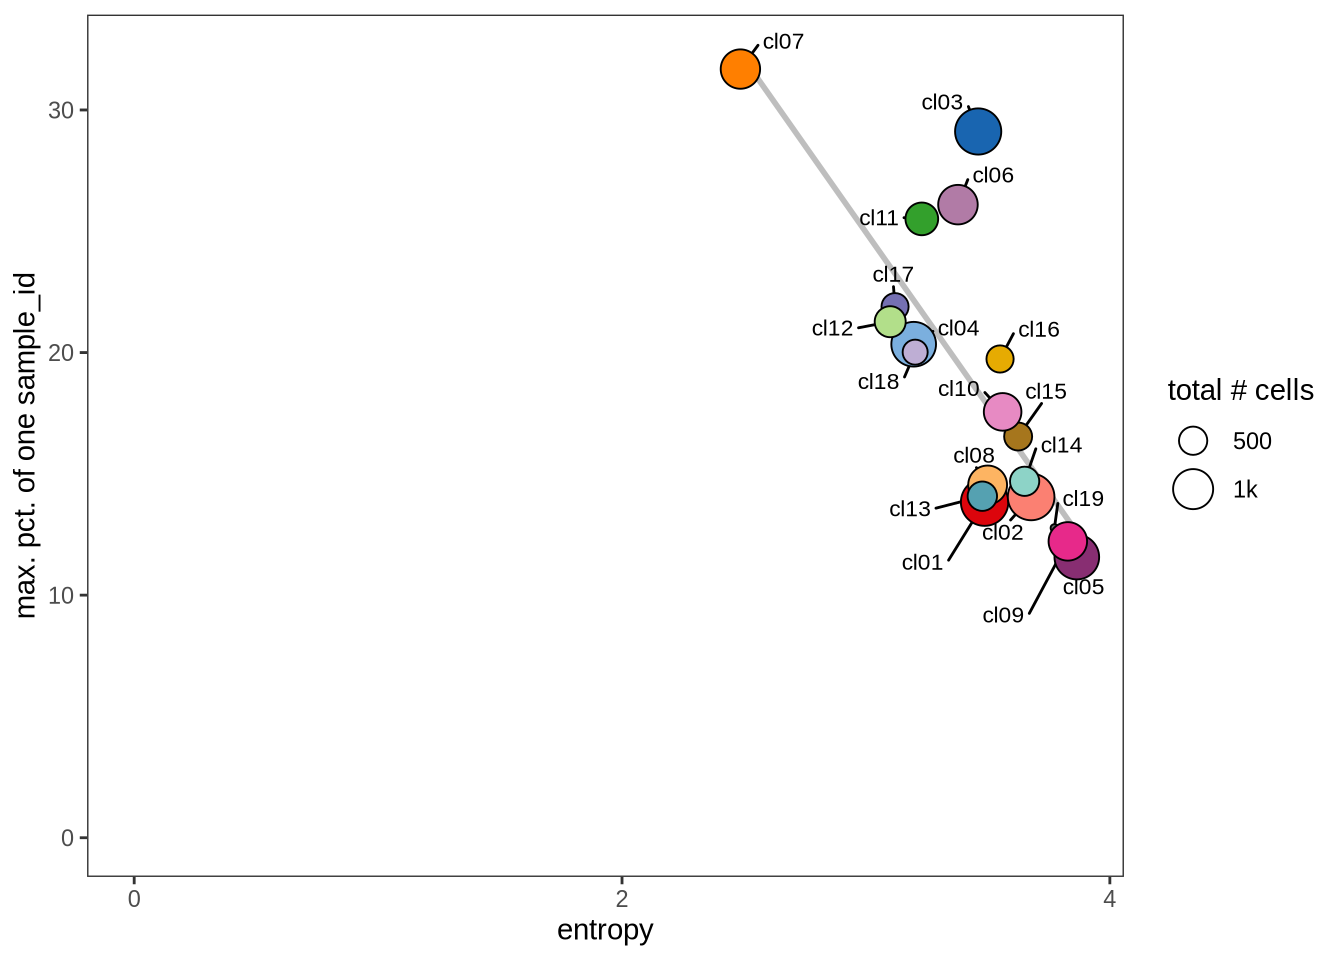
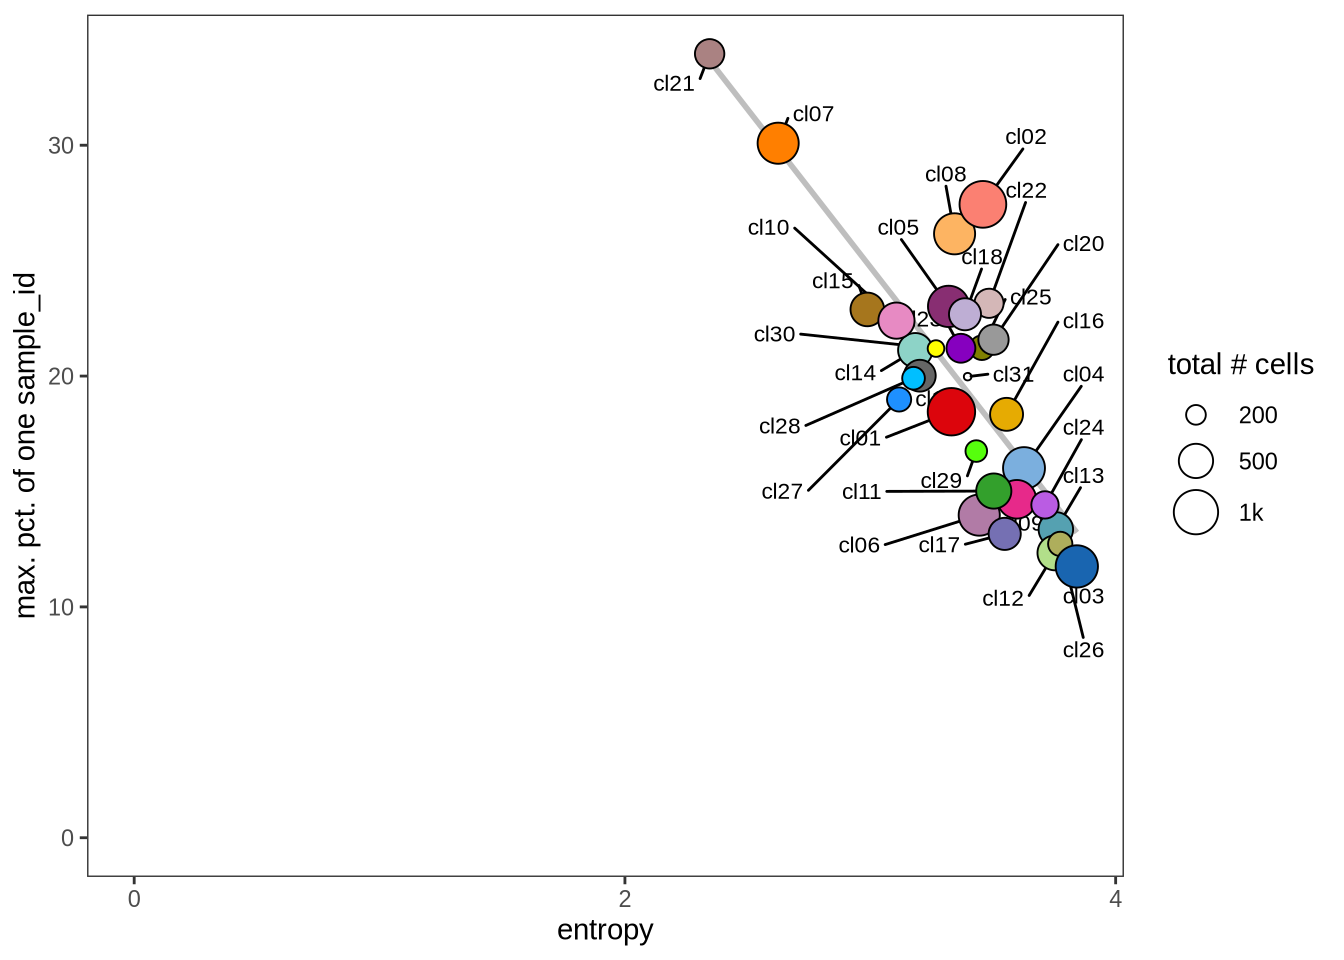
Evaluating cluster distribution across samples
This plot visualizes the relationship between the entropy of clusters and the maximum proportion of cells from a single sample within each cluster (higher values suggest that a cluster predominantly contains cells from a single sample). Entropy measures how evenly distributed cells are across samples within each cluster—higher entropy indicates that cells from different samples are more evenly distributed, while lower entropy suggests that a cluster is dominated by cells from a small number of samples.
n_clusts = res_ls %>% lapply(function(res){
  tmp_dt = int_dt[, .(cluster = get(paste0('RNA_snn_res.', res)))]
  length(unique(tmp_dt$cluster))
})

res_ls_pl = res_ls[n_clusts > 1]
for (res in res_ls_pl) {
  cat('#### ', res, '\n')
  input_dt  = int_dt[, .(batch_var = get(batch_var), cell_id, cluster = get(paste0('RNA_snn_res.', res)))]
  suppressWarnings(print(plot_cluster_entropies(input_dt,batch_var, what = "norm")))
  cat('\n\n')
}
0.1
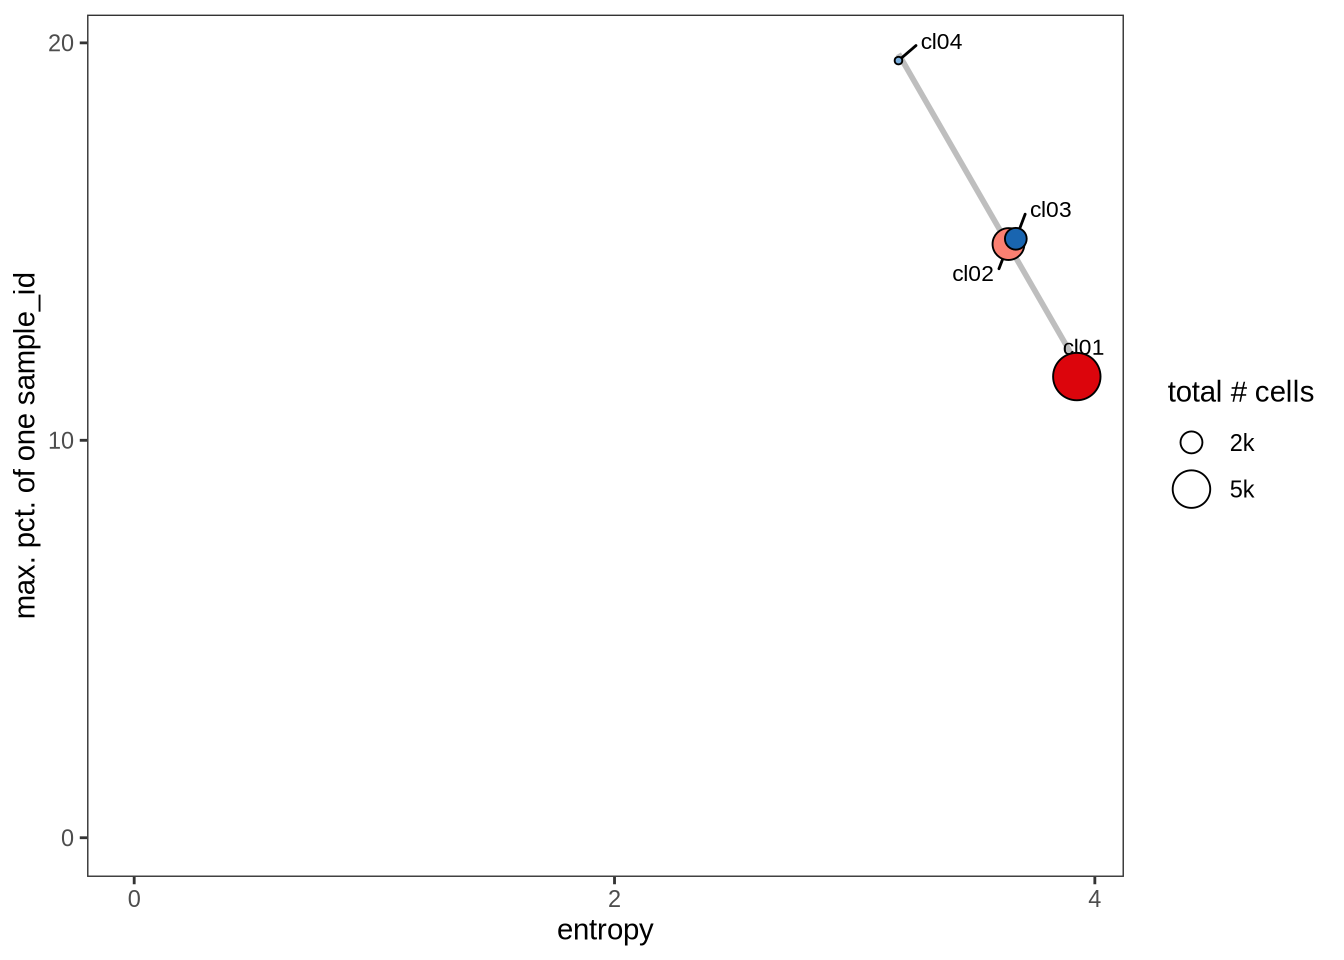
0.2
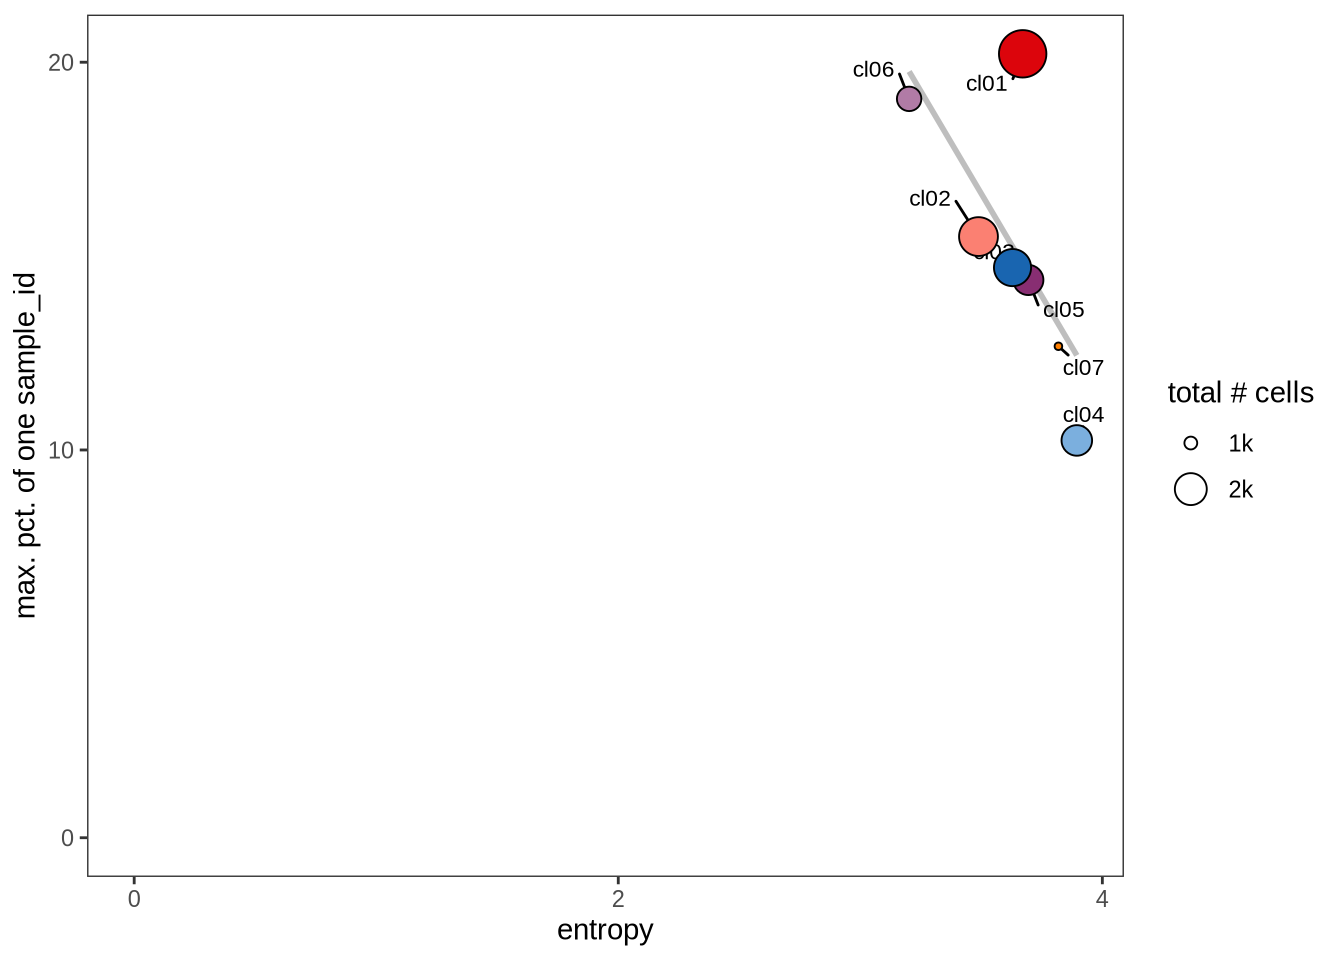
0.5
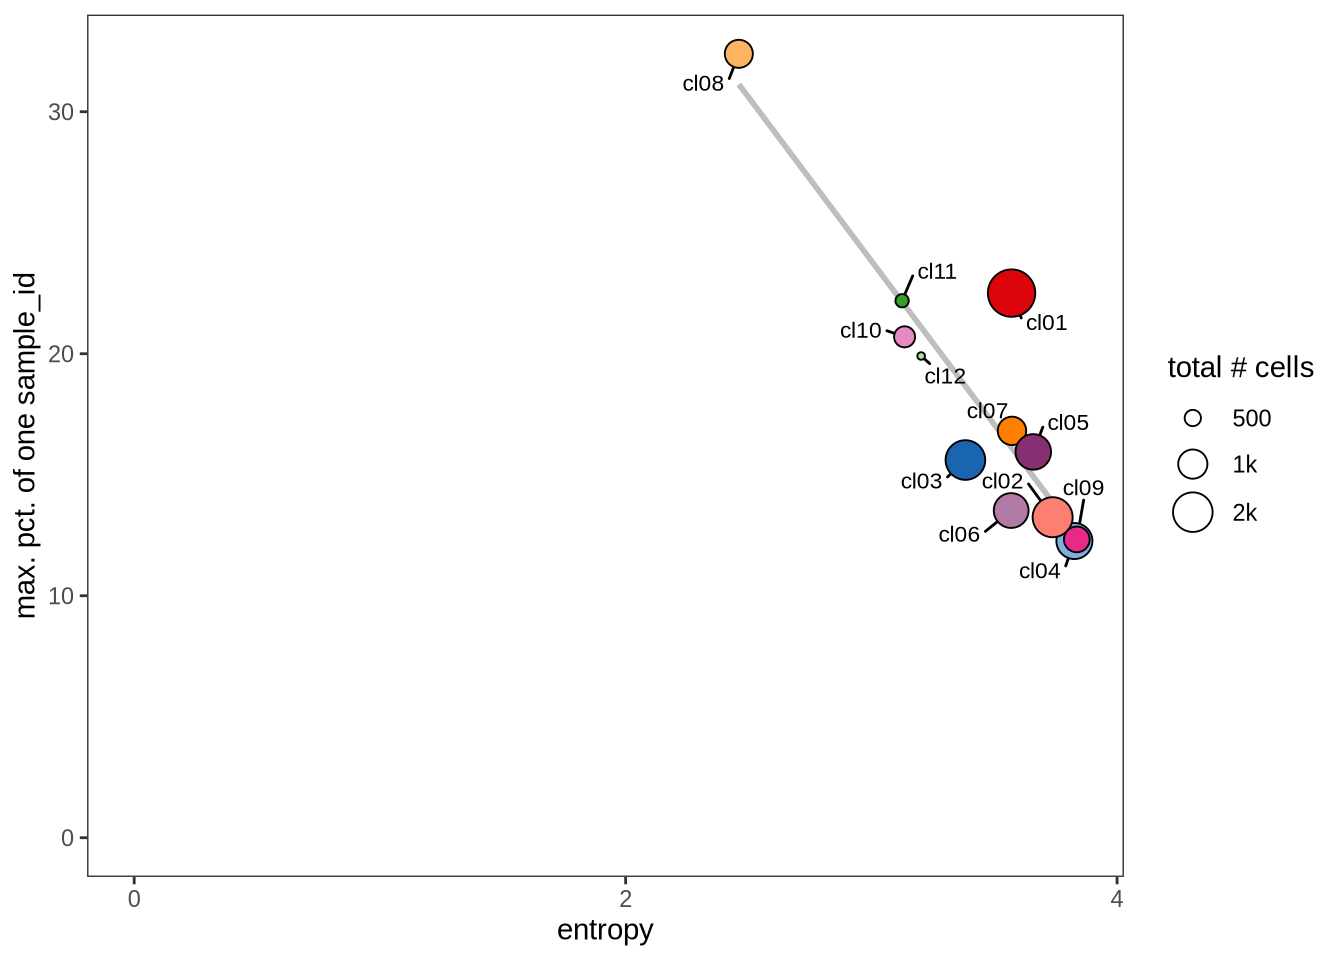
1
2
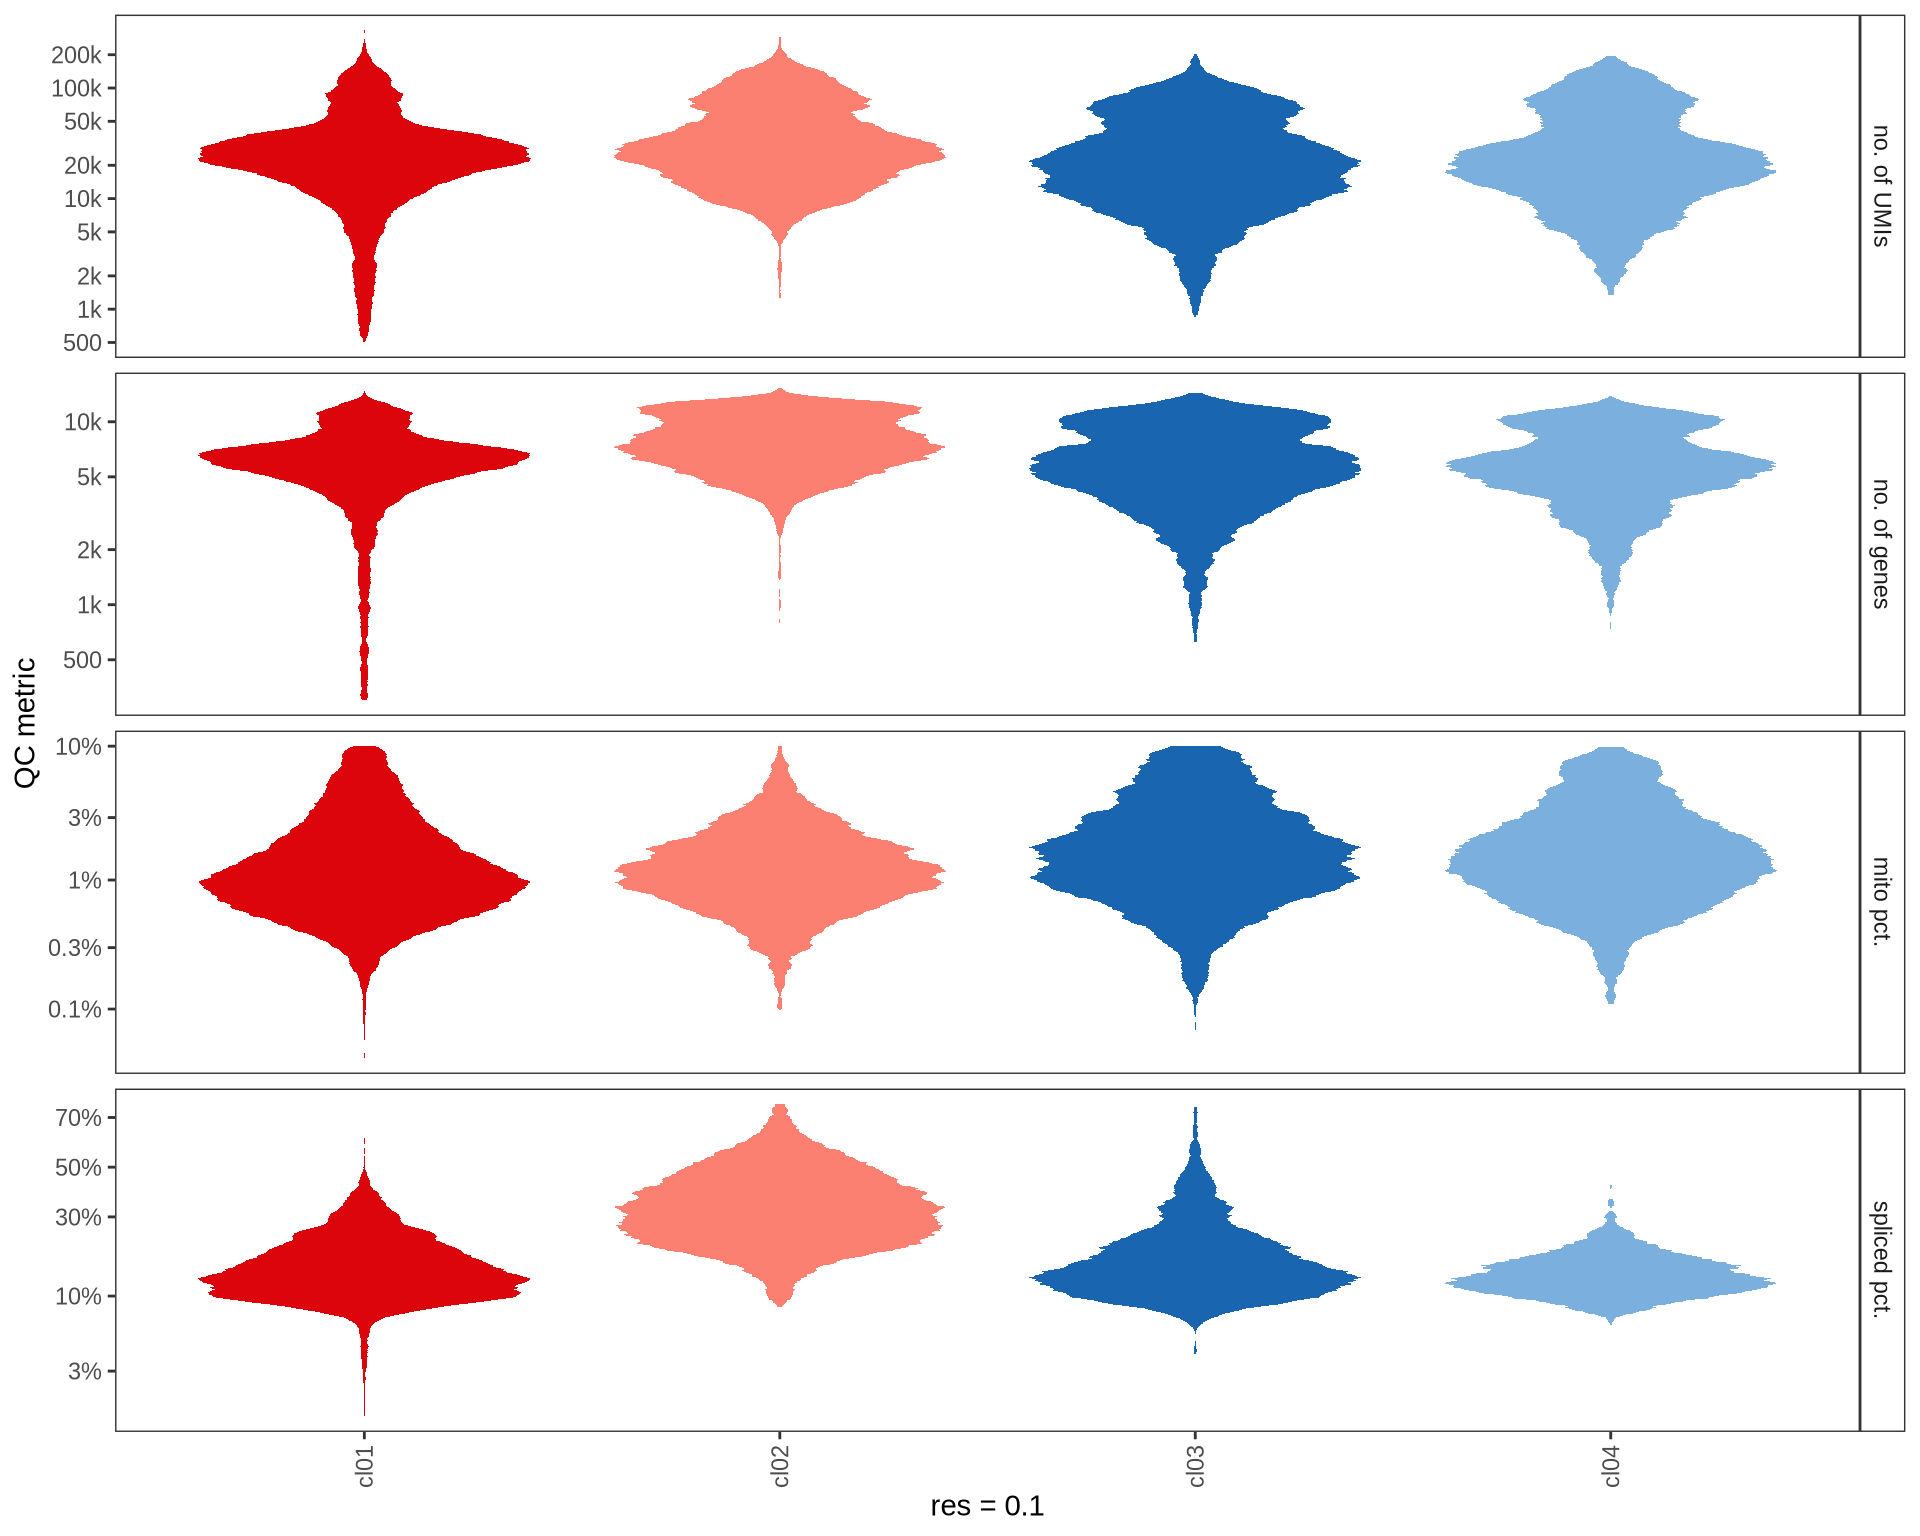
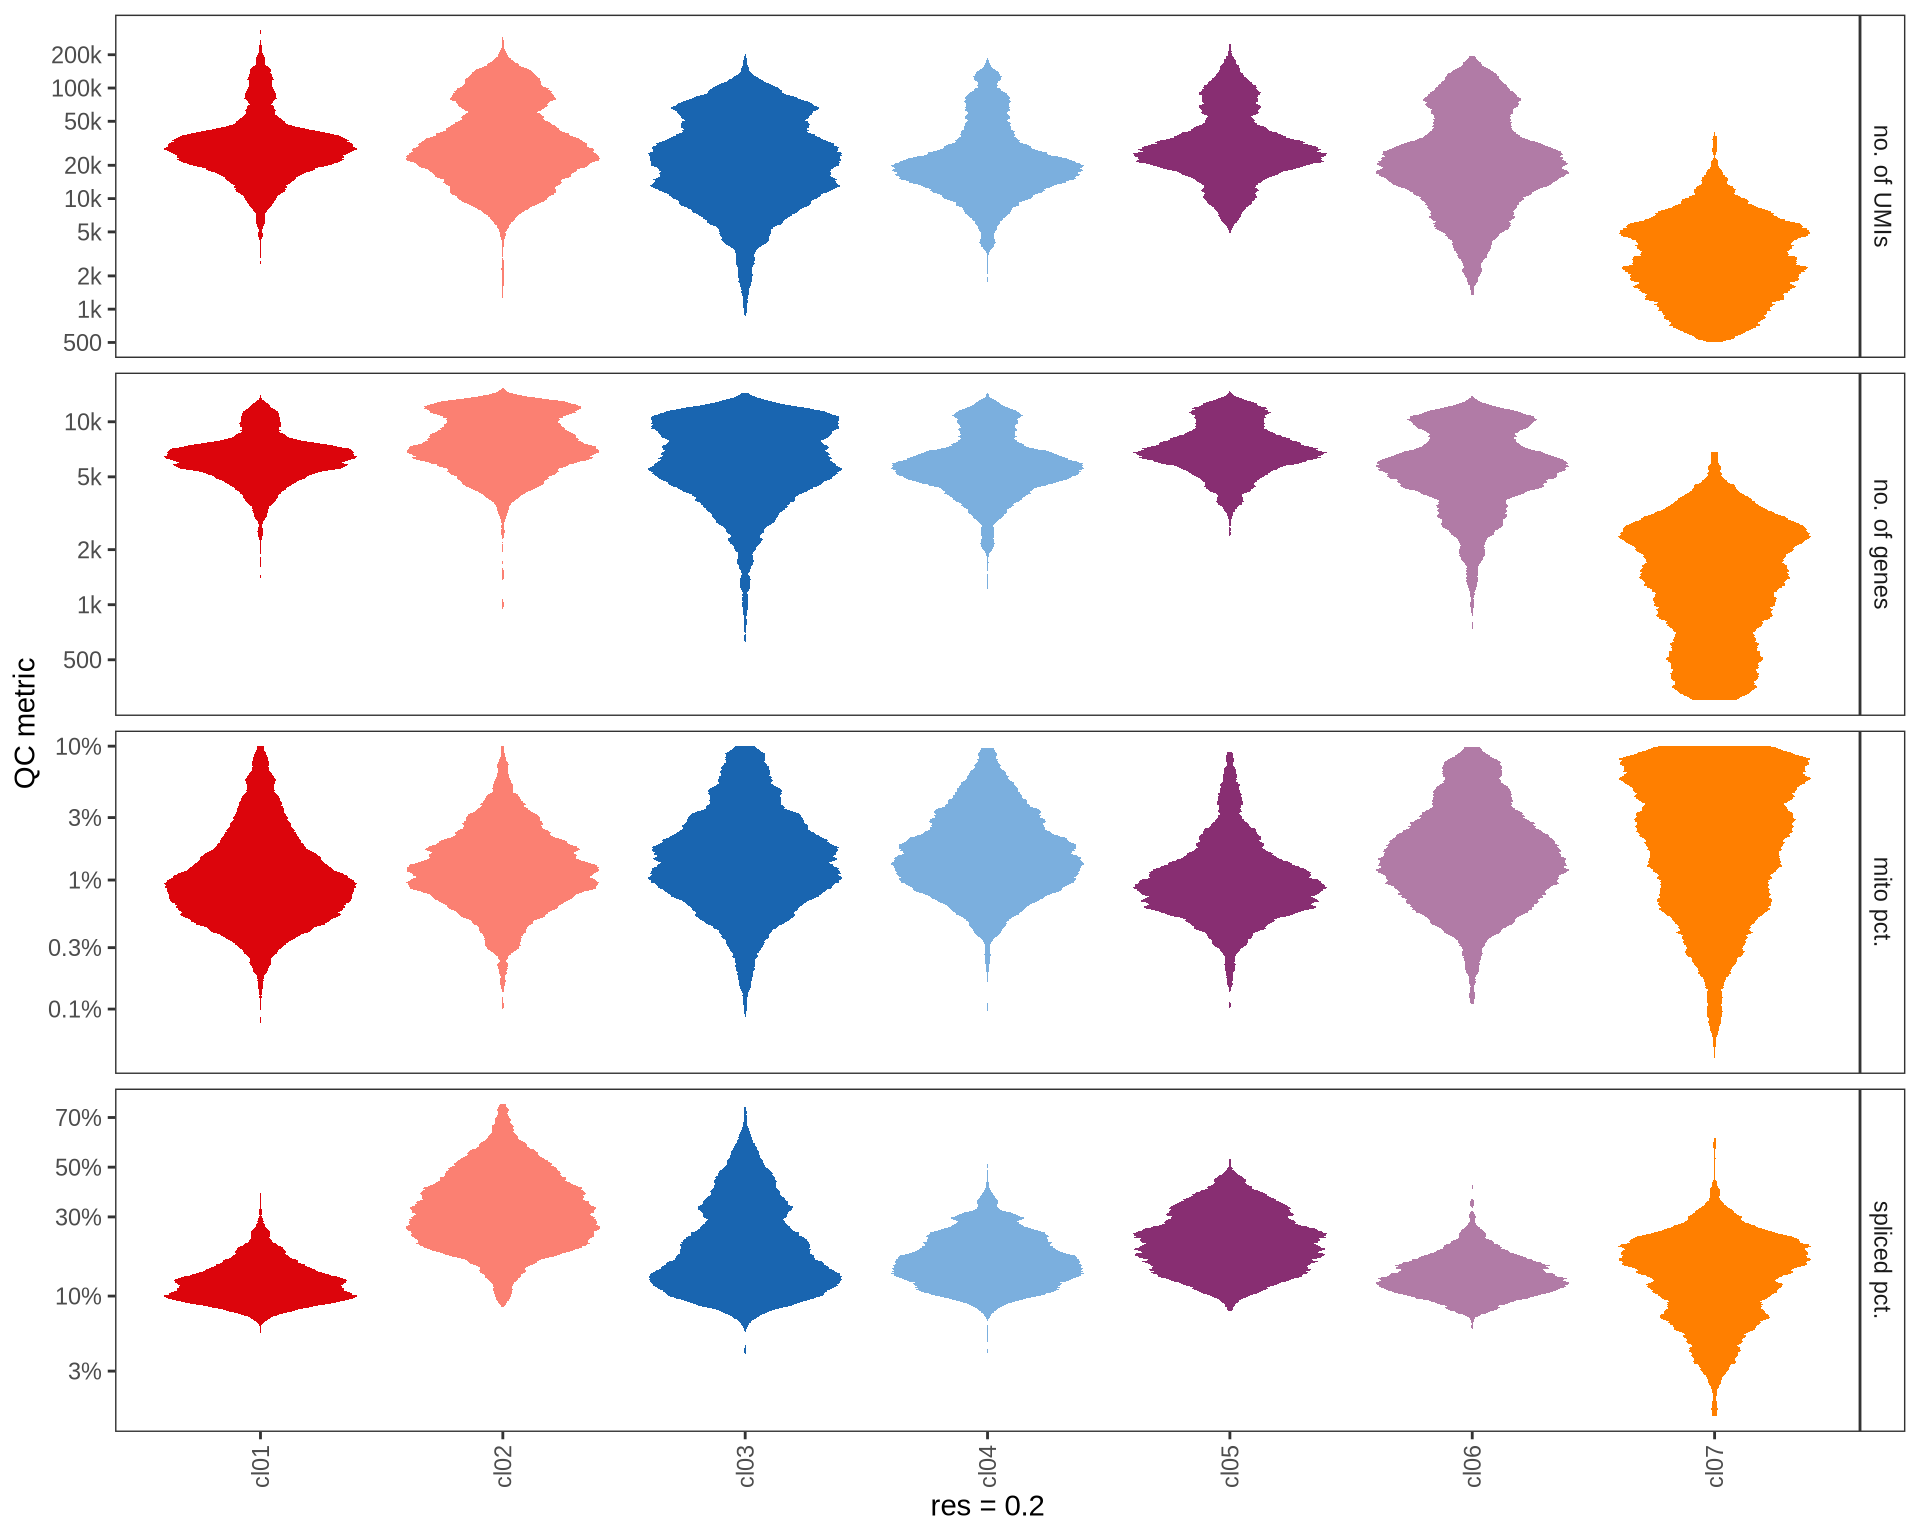
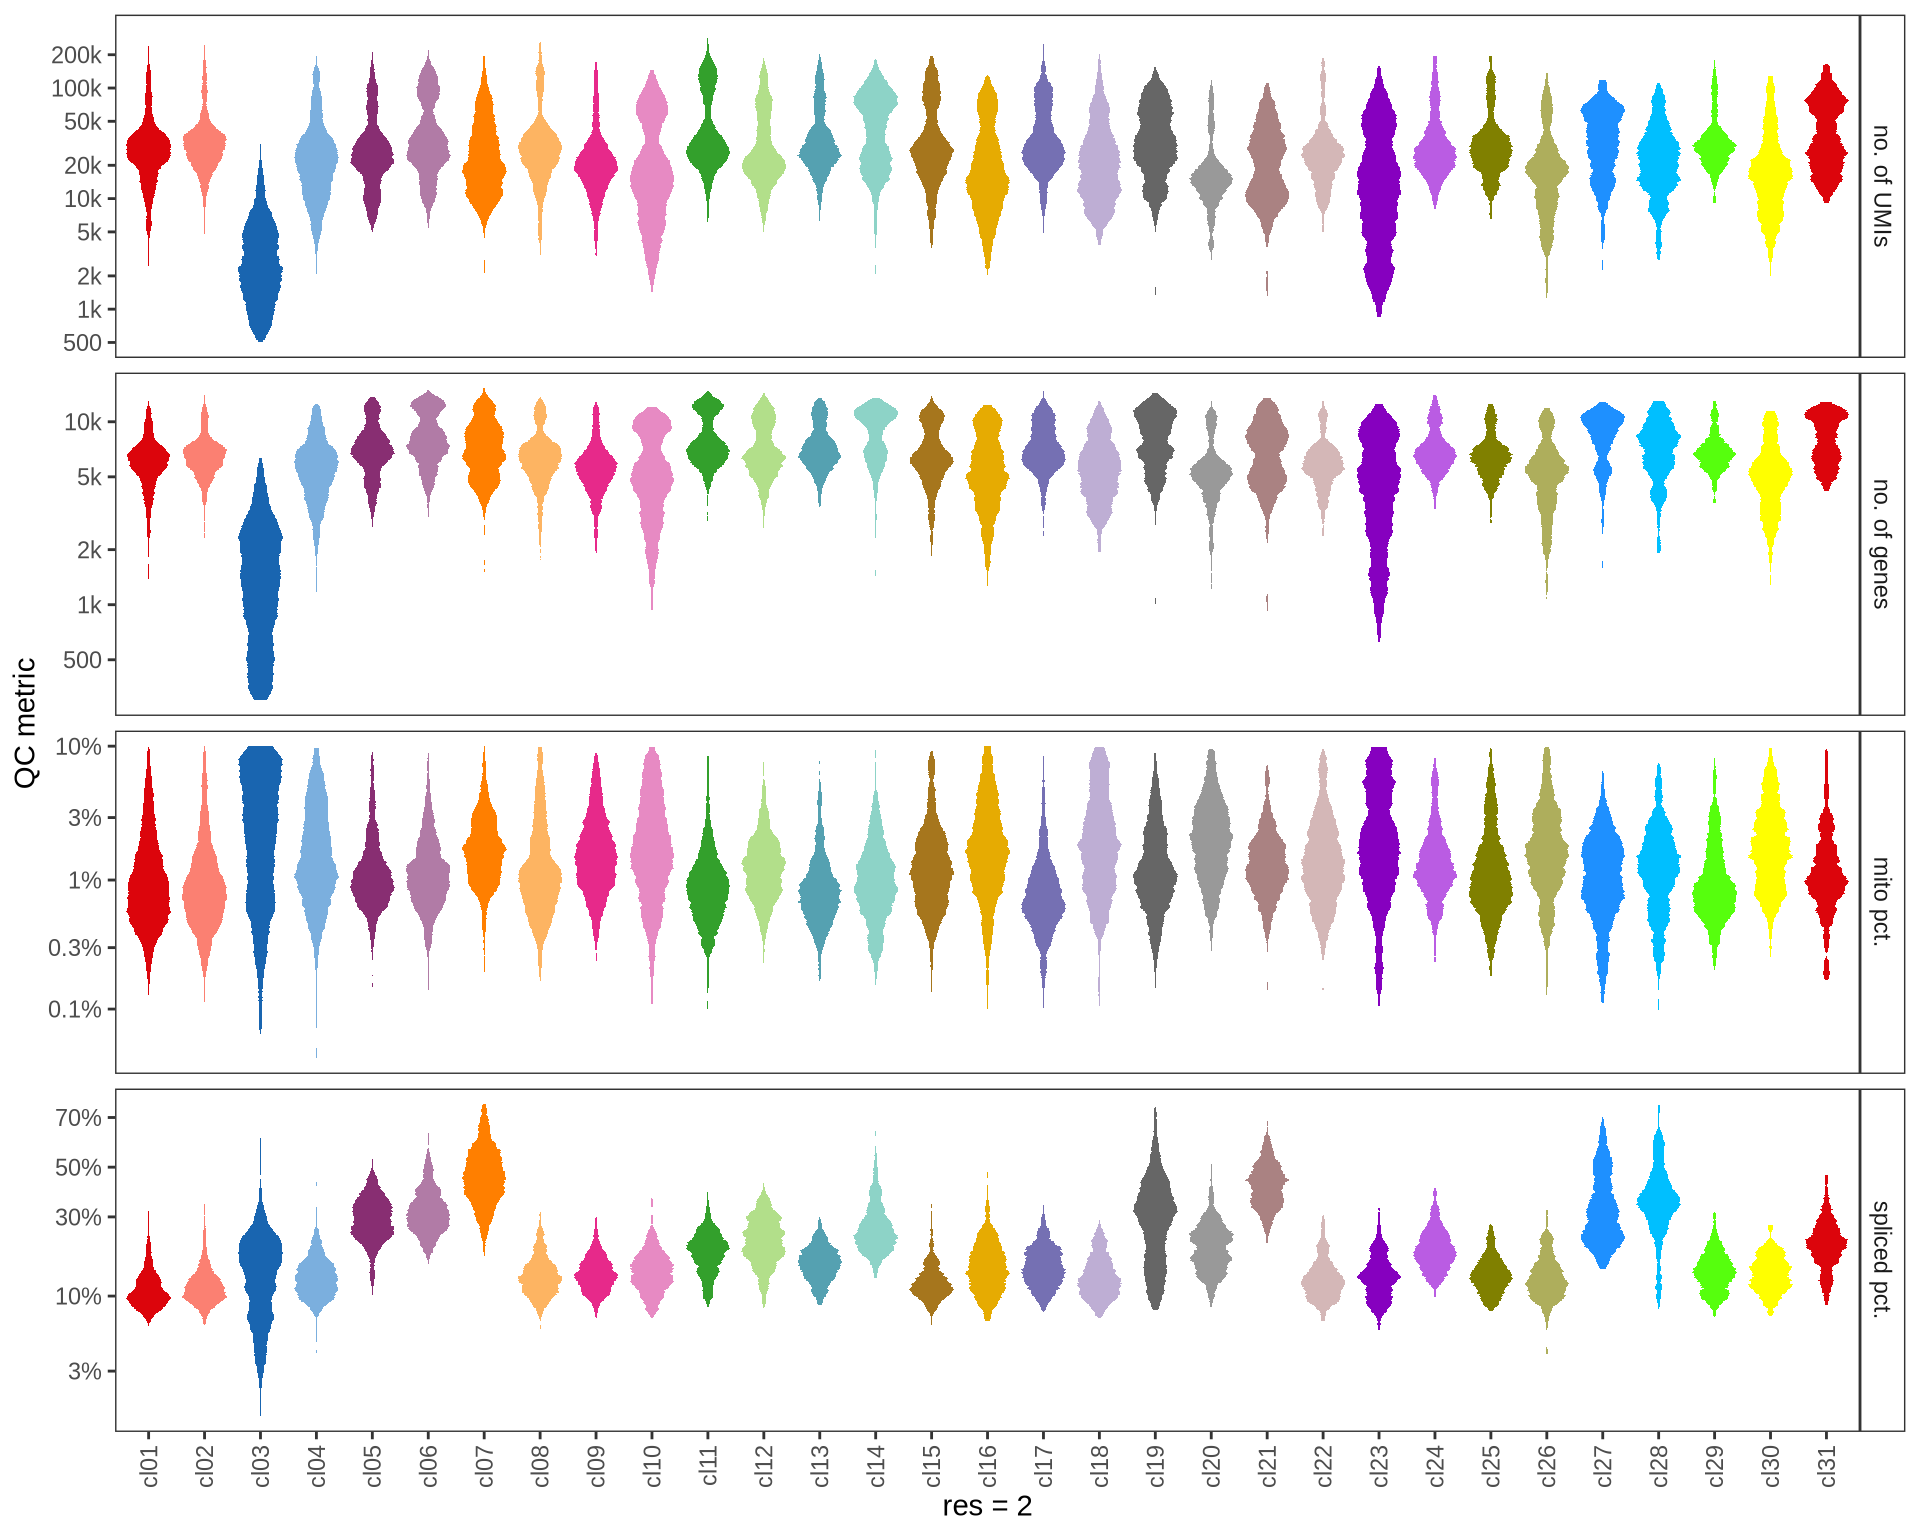
QC metrics of clusters
Distributions of QC metrics (library size, number of features, mitochondrial proportion, and spliced proportion) are shown for each cluster across different resolution values.
for (res in res_ls) {
  cat('#### ', res, '\n')
  suppressWarnings(print(plot_cluster_qc_distns(
    qc_melt,
    clust_dt  = int_dt[, .(cell_id, cluster = get(paste0('RNA_snn_res.', res)))],
    name      = res)))
  cat('\n\n')
}
0.1
0.2
0.5
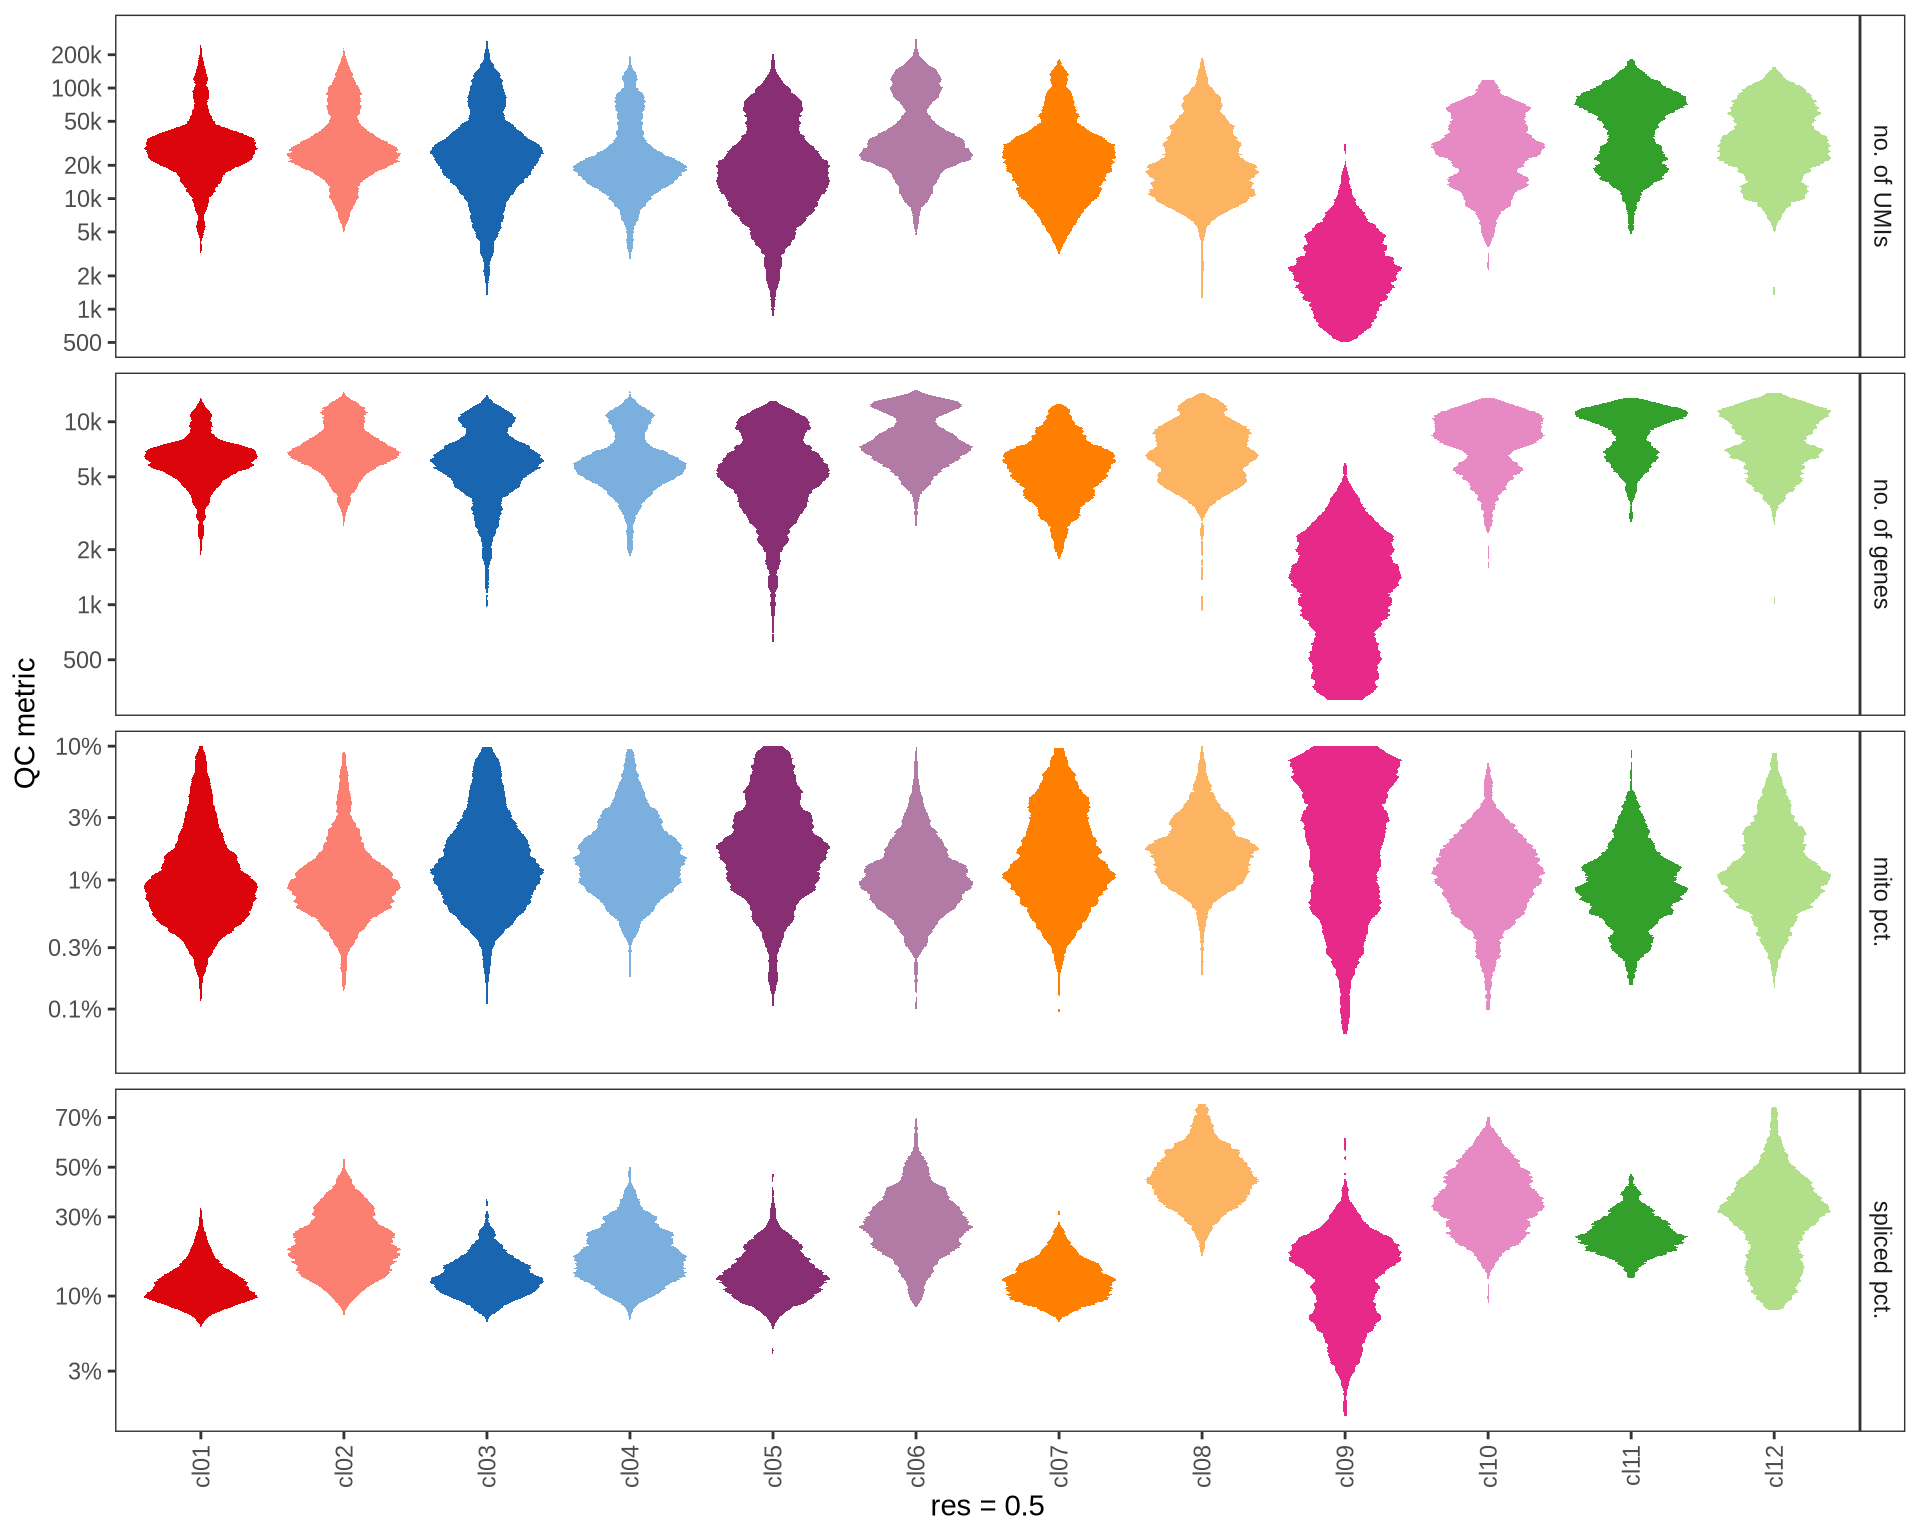
1
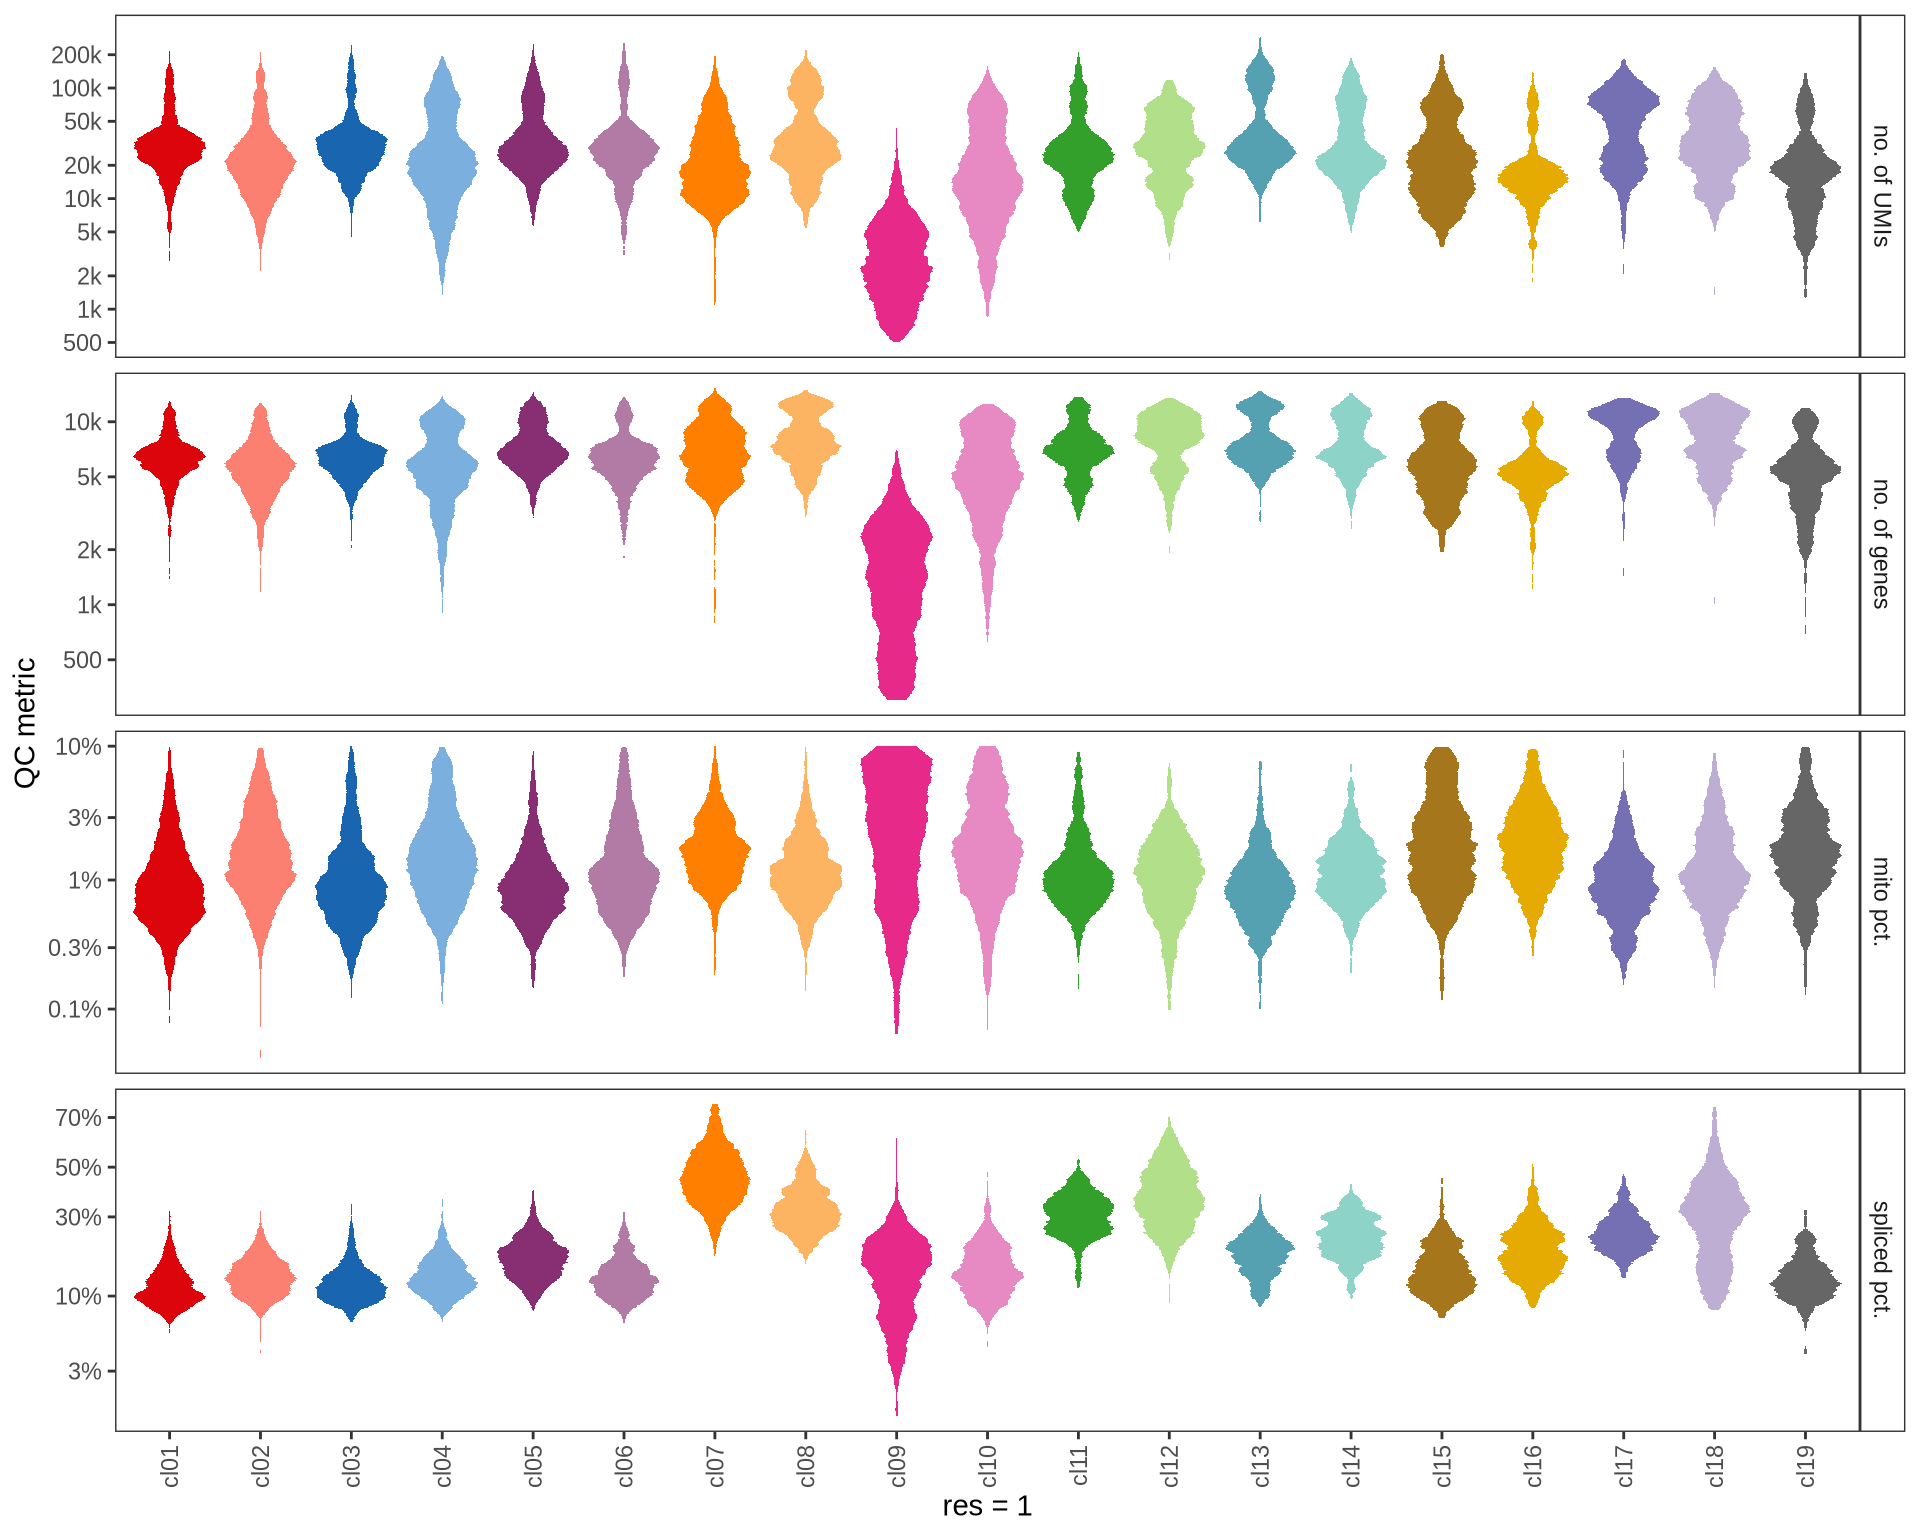
2
Marker genes
To identify marker genes for each cluster (resolution: 0.2),
pseudobulk counts are generated by aggregating the expression values of
cells within a specific cluster for each sample. Similarly, pseudobulk
counts are generated for the remaining clusters by aggregating
expression values separately for each sample. The resulting pseudobulk
values for the target cluster are then compared to those of the
remaining clusters using edgeR.
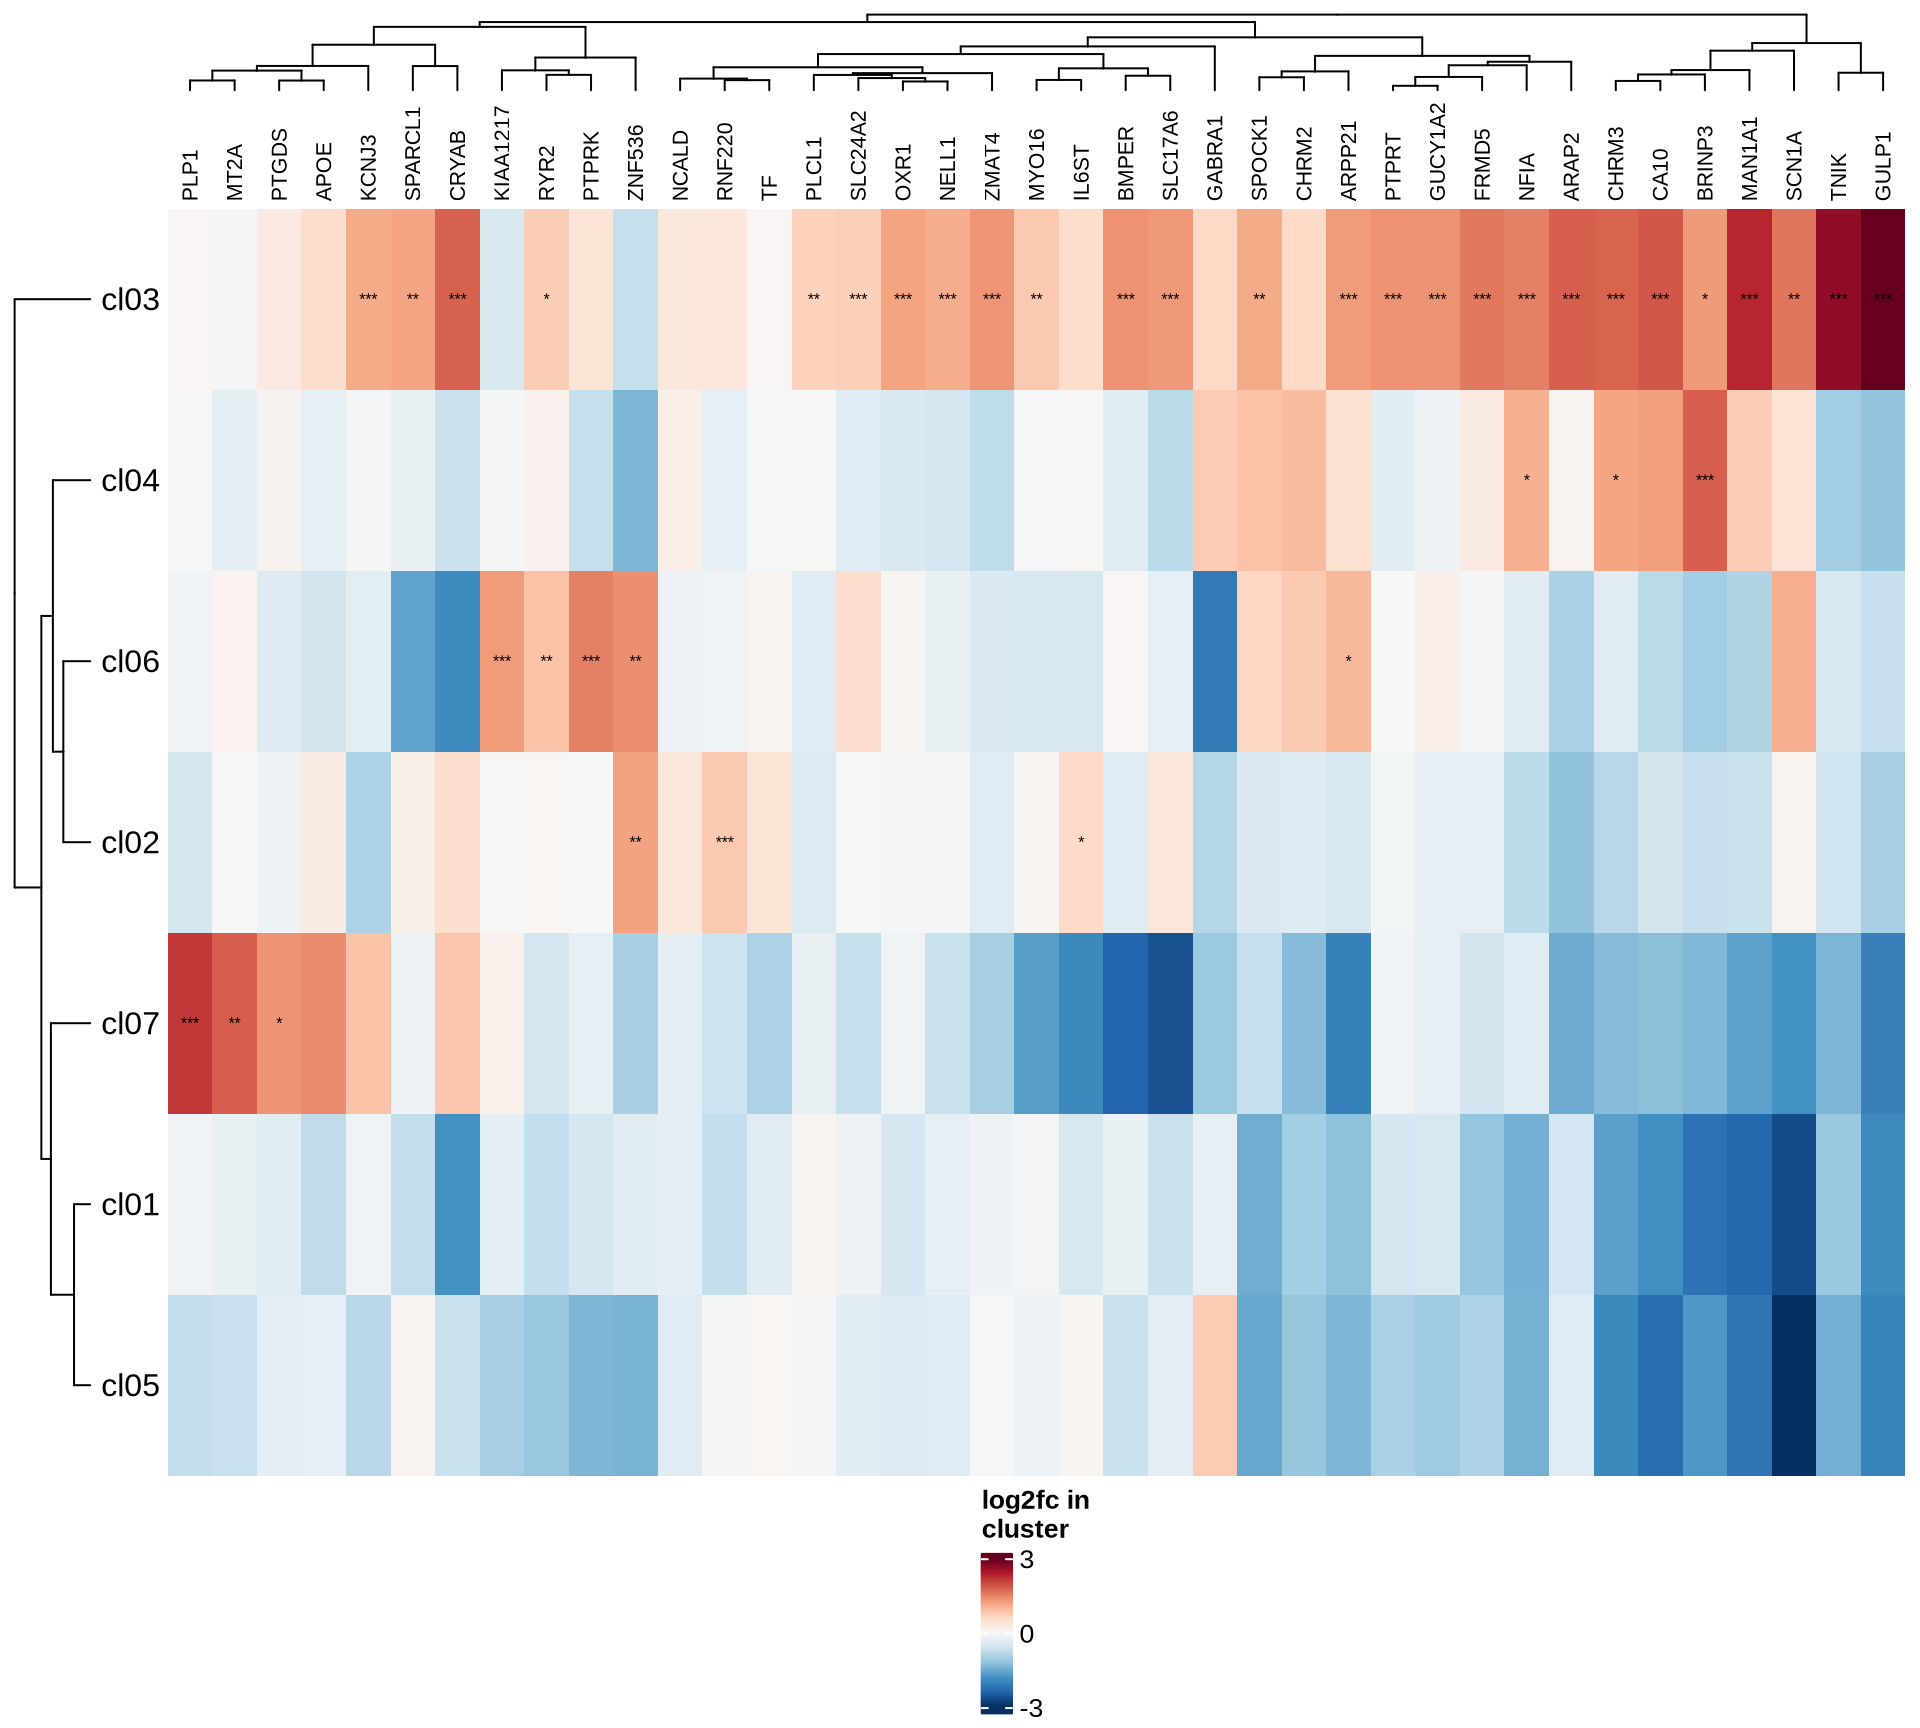
Heatmaps of marker genes
The resulting log2 fold change values (calculated using
edgeR) per cluster are shown for several genesets:
- selected canonical marker genes, if specified in the config file;
- the 50 most highly variable genes; and
- the 50 genes most likely to represent ambient RNA contamination.
for (nn in names(mkrs_ls)) {
  cat("#### ", nn, "\n")
  suppressMessages(draw( plot_heatmap_of_selected_genes(mkrs_dt, mkrs_ls[[nn]]),
    heatmap_legend_side = "bottom", annotation_legend_side = "bottom", merge_legend = TRUE ))
  cat("\n\n")
}
human_brain
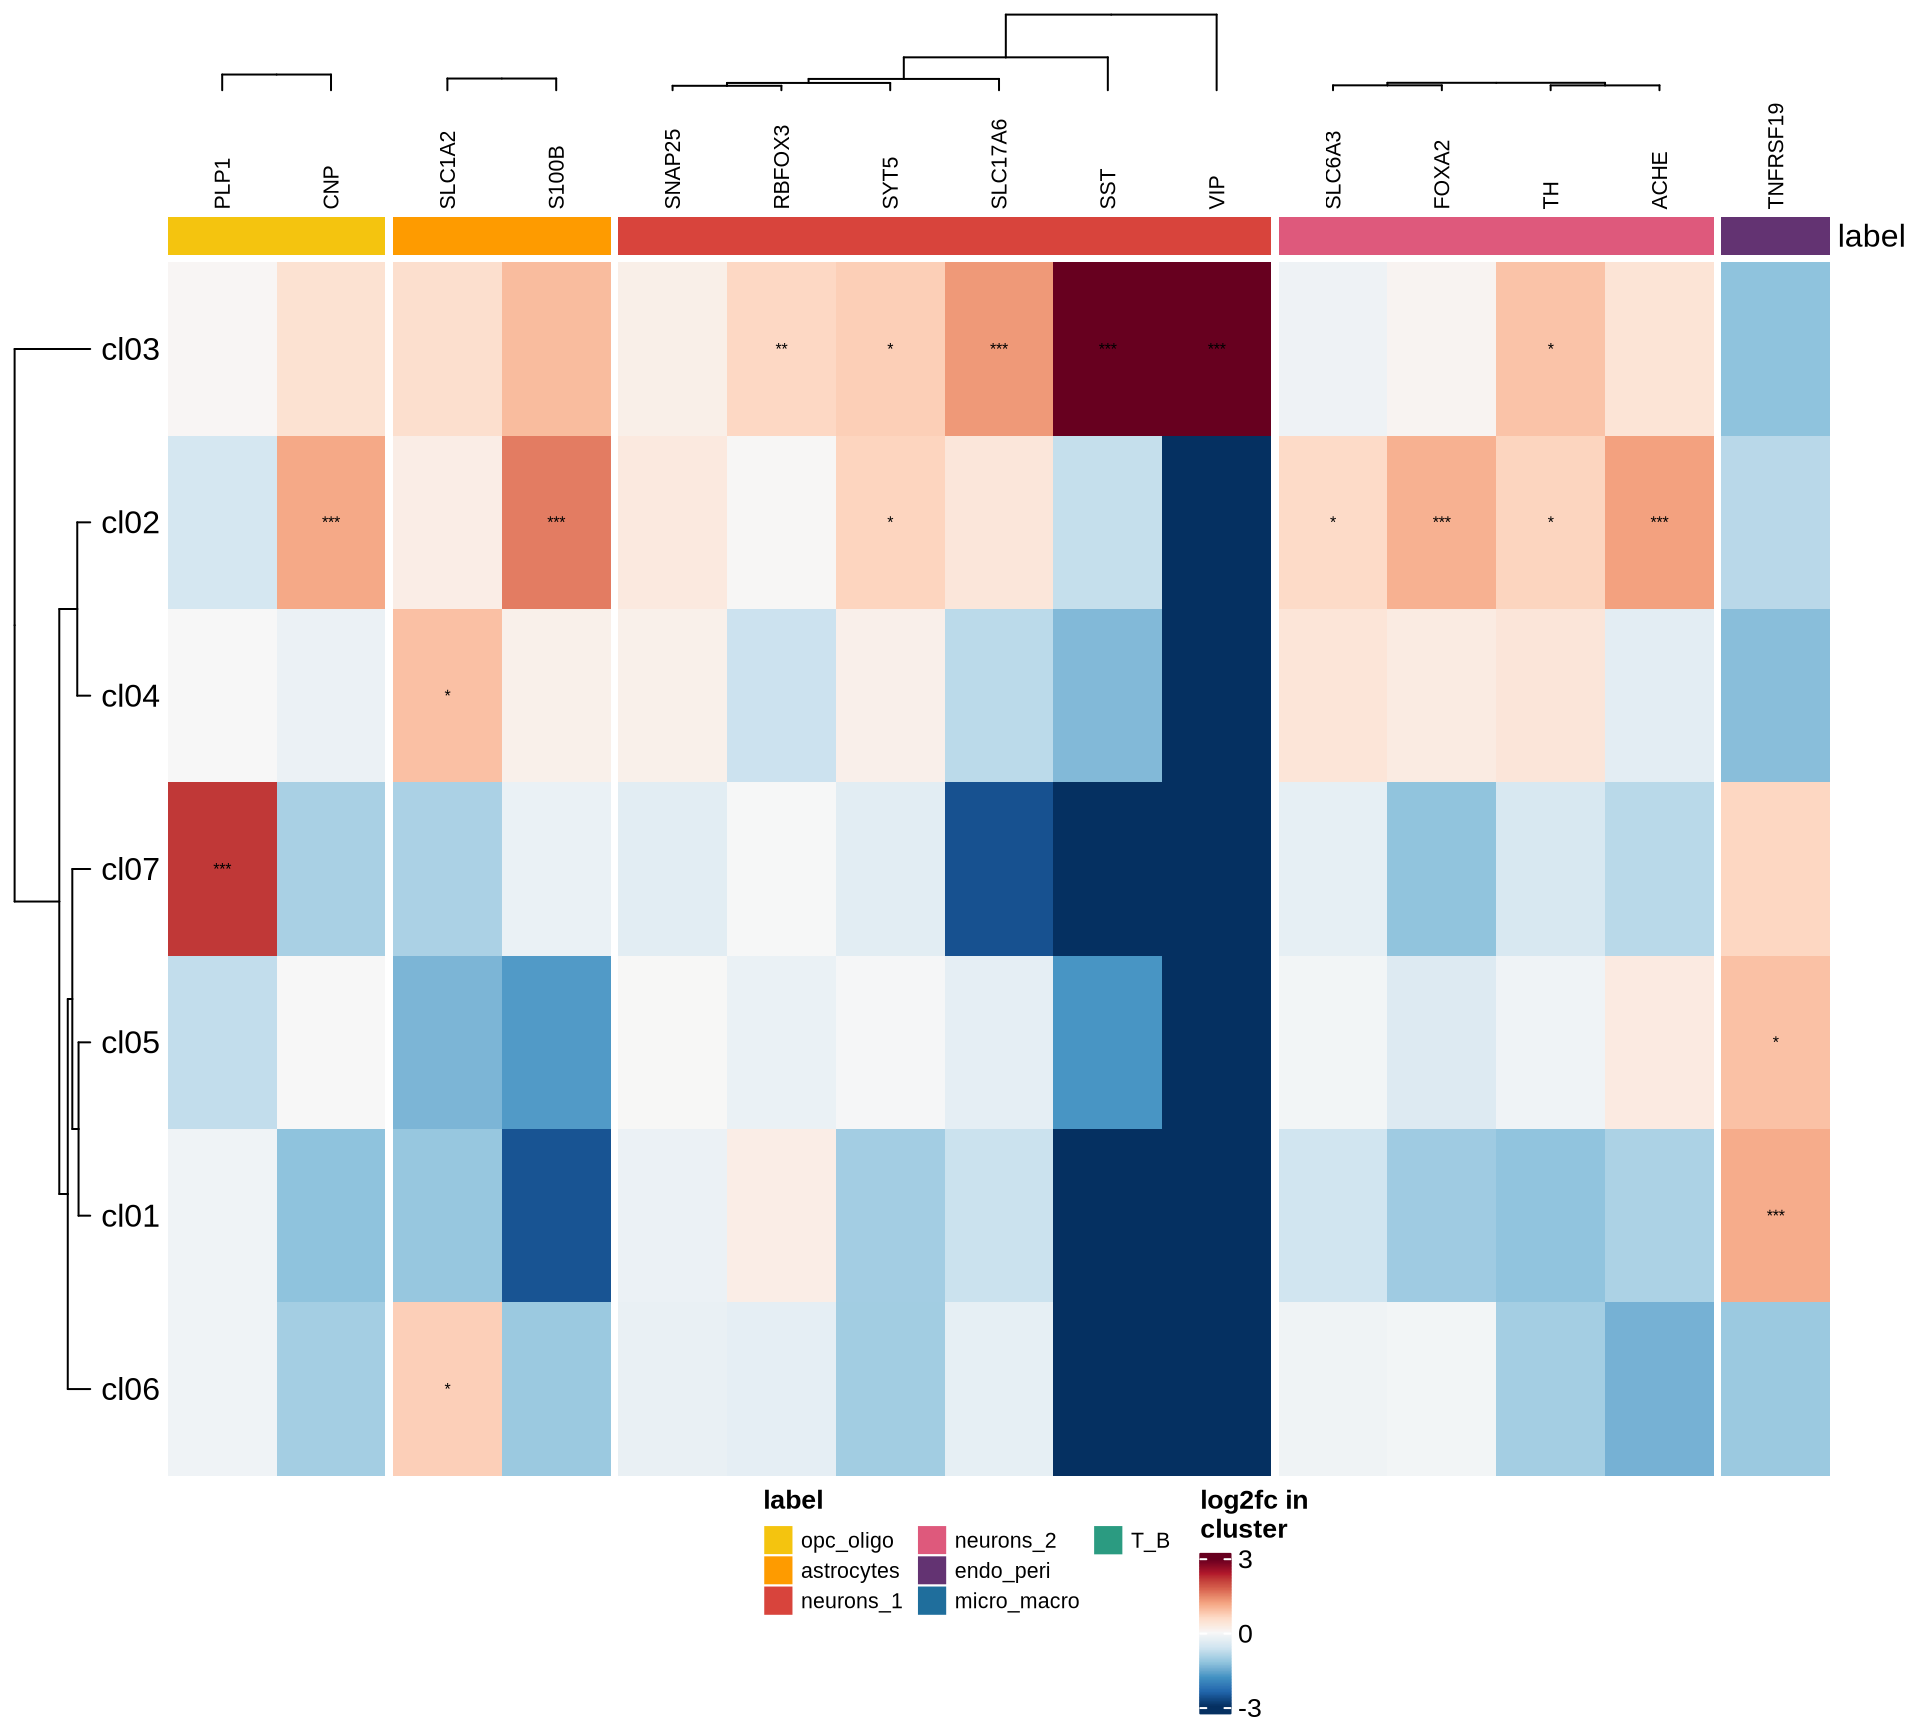
HVGs
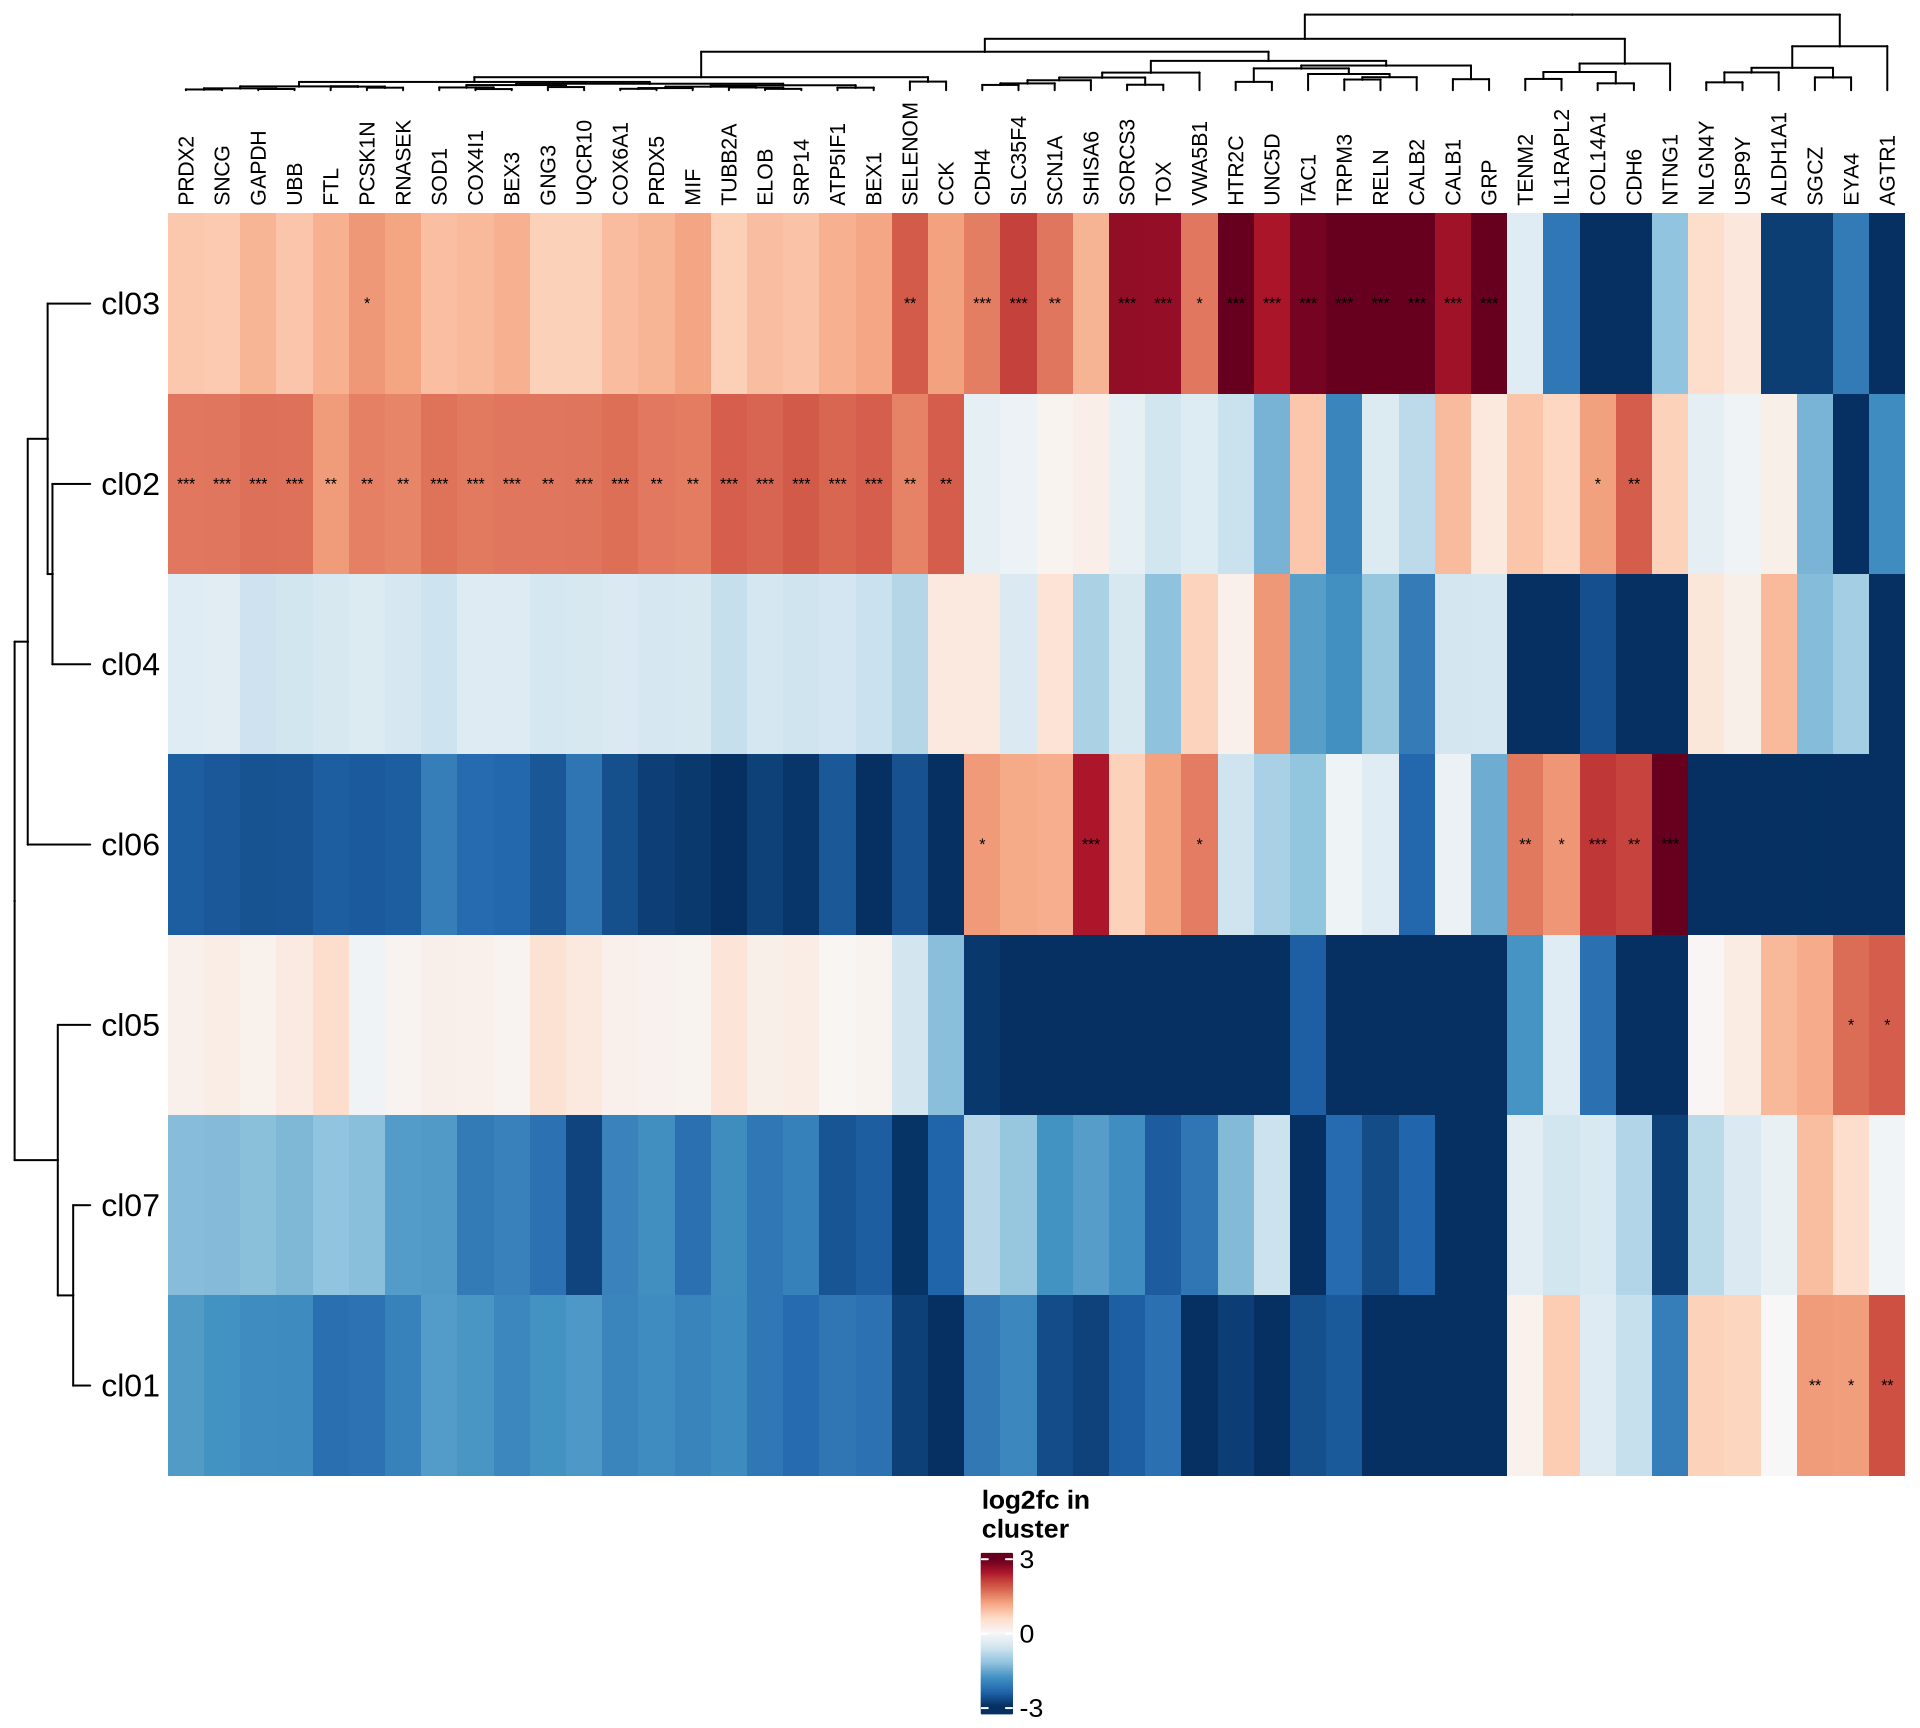
ambient
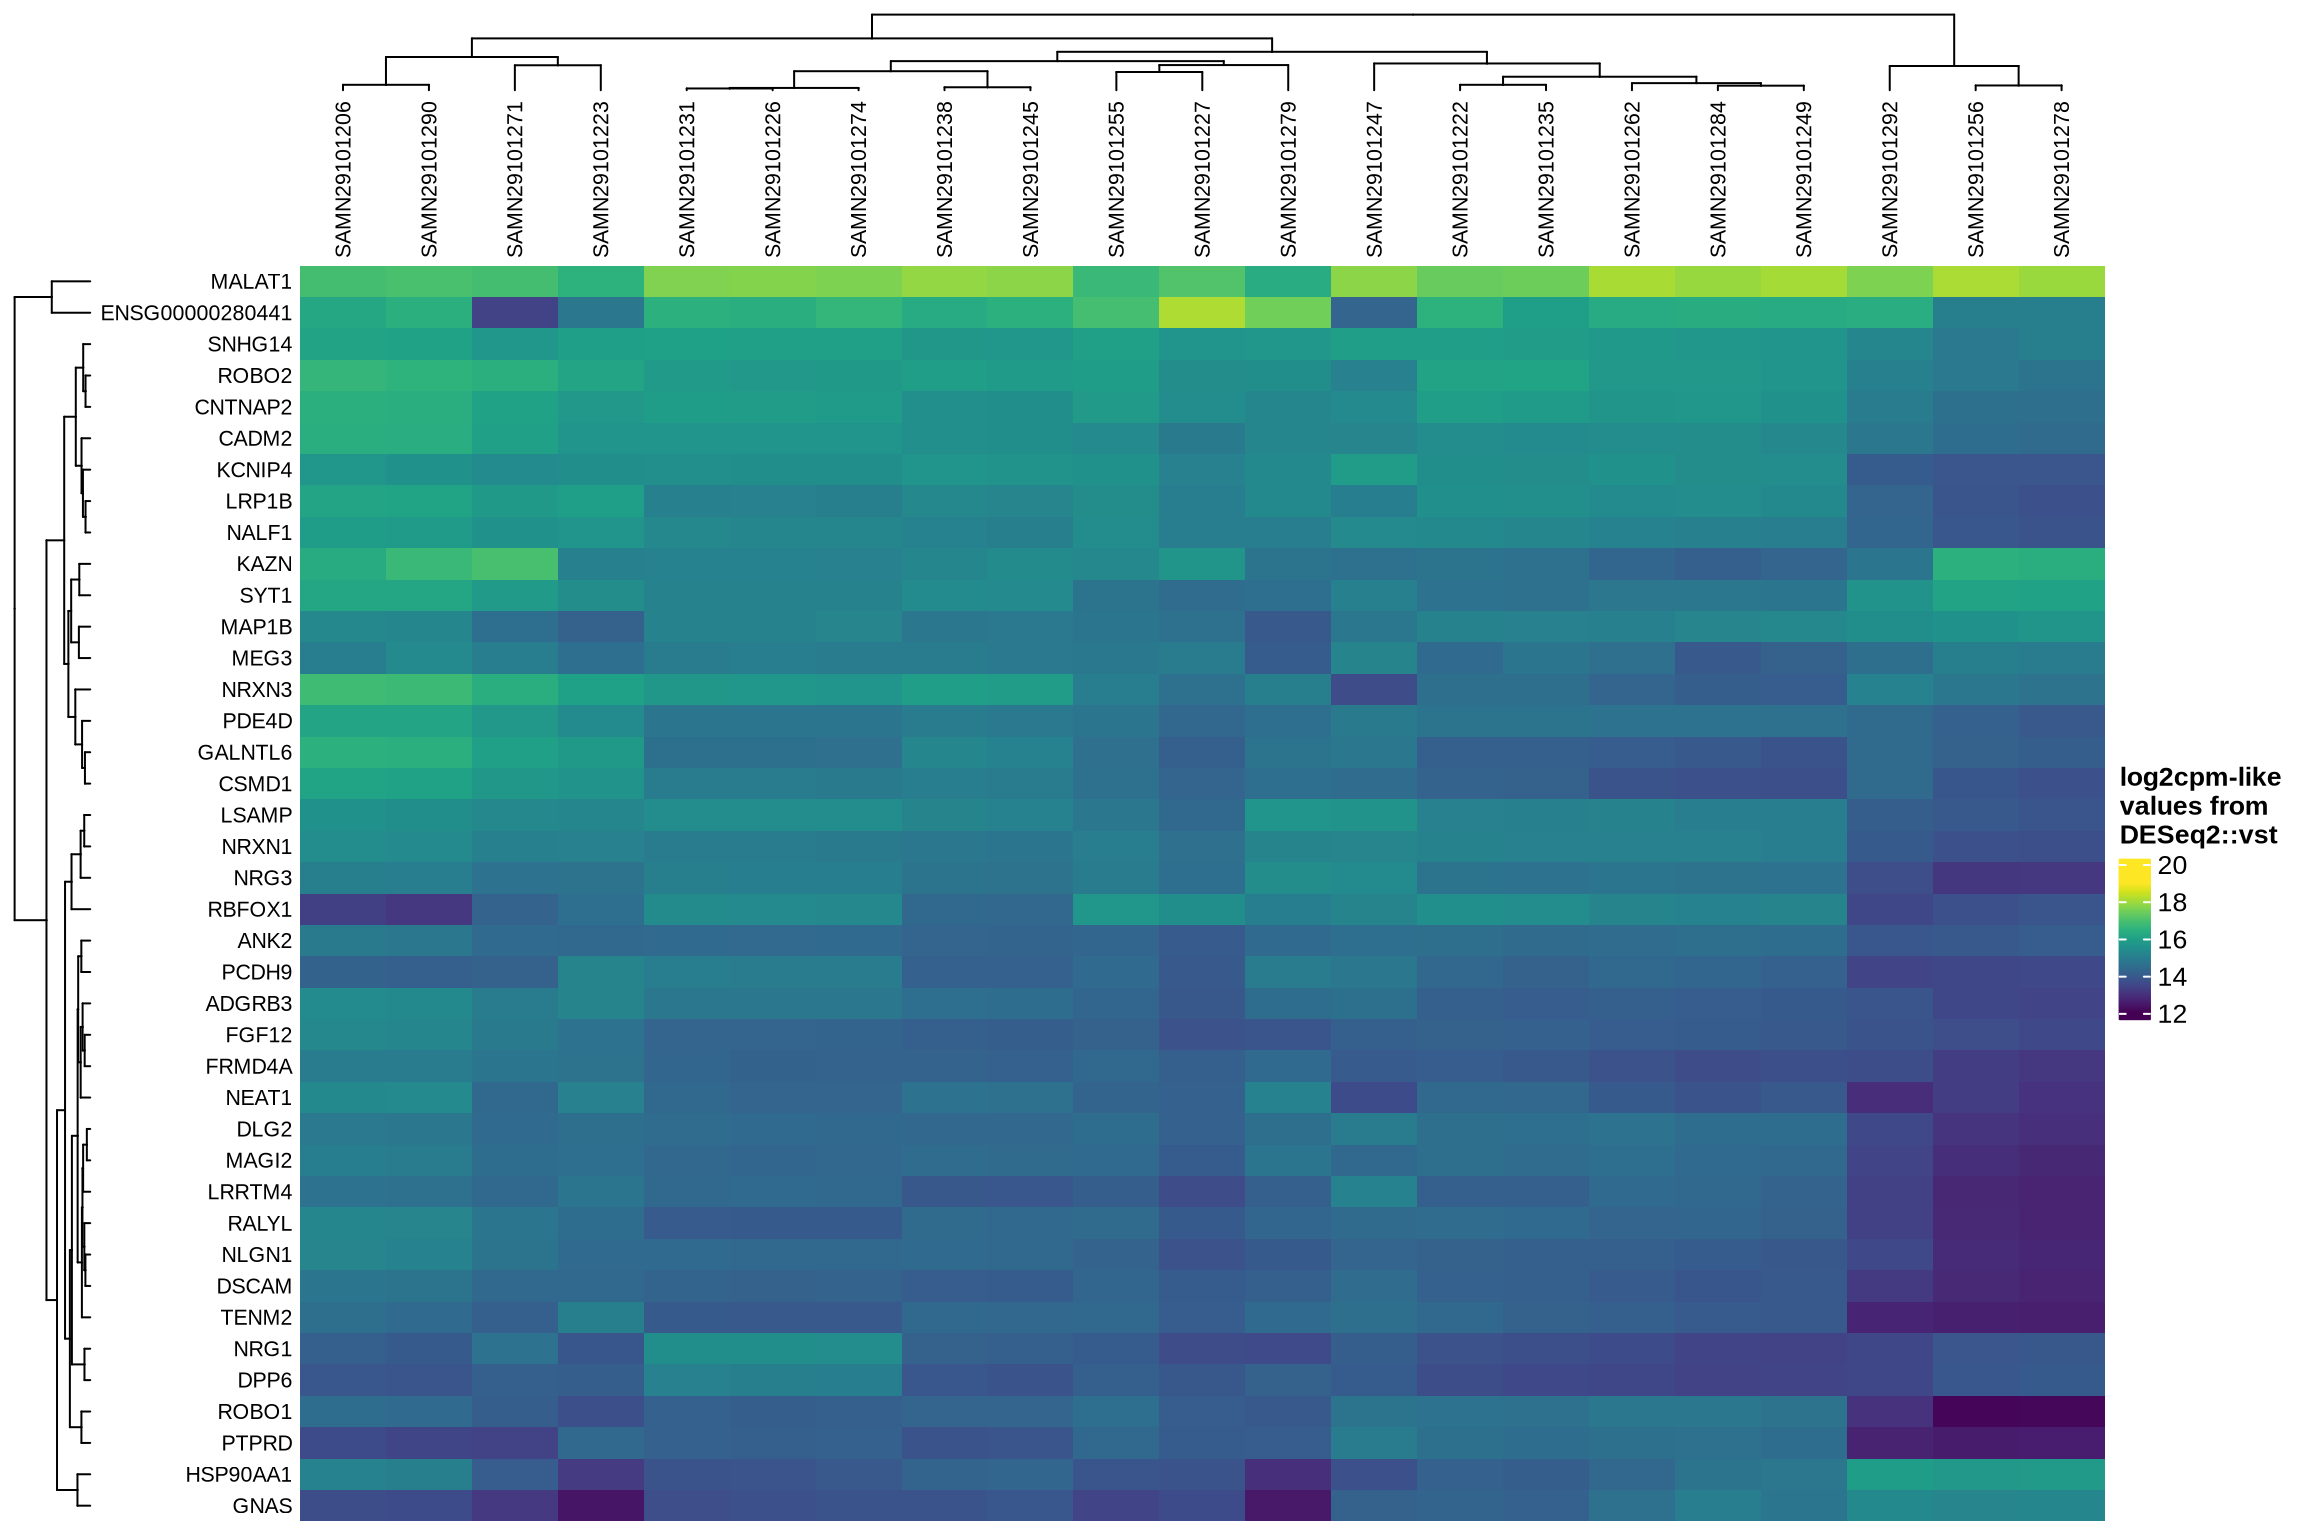
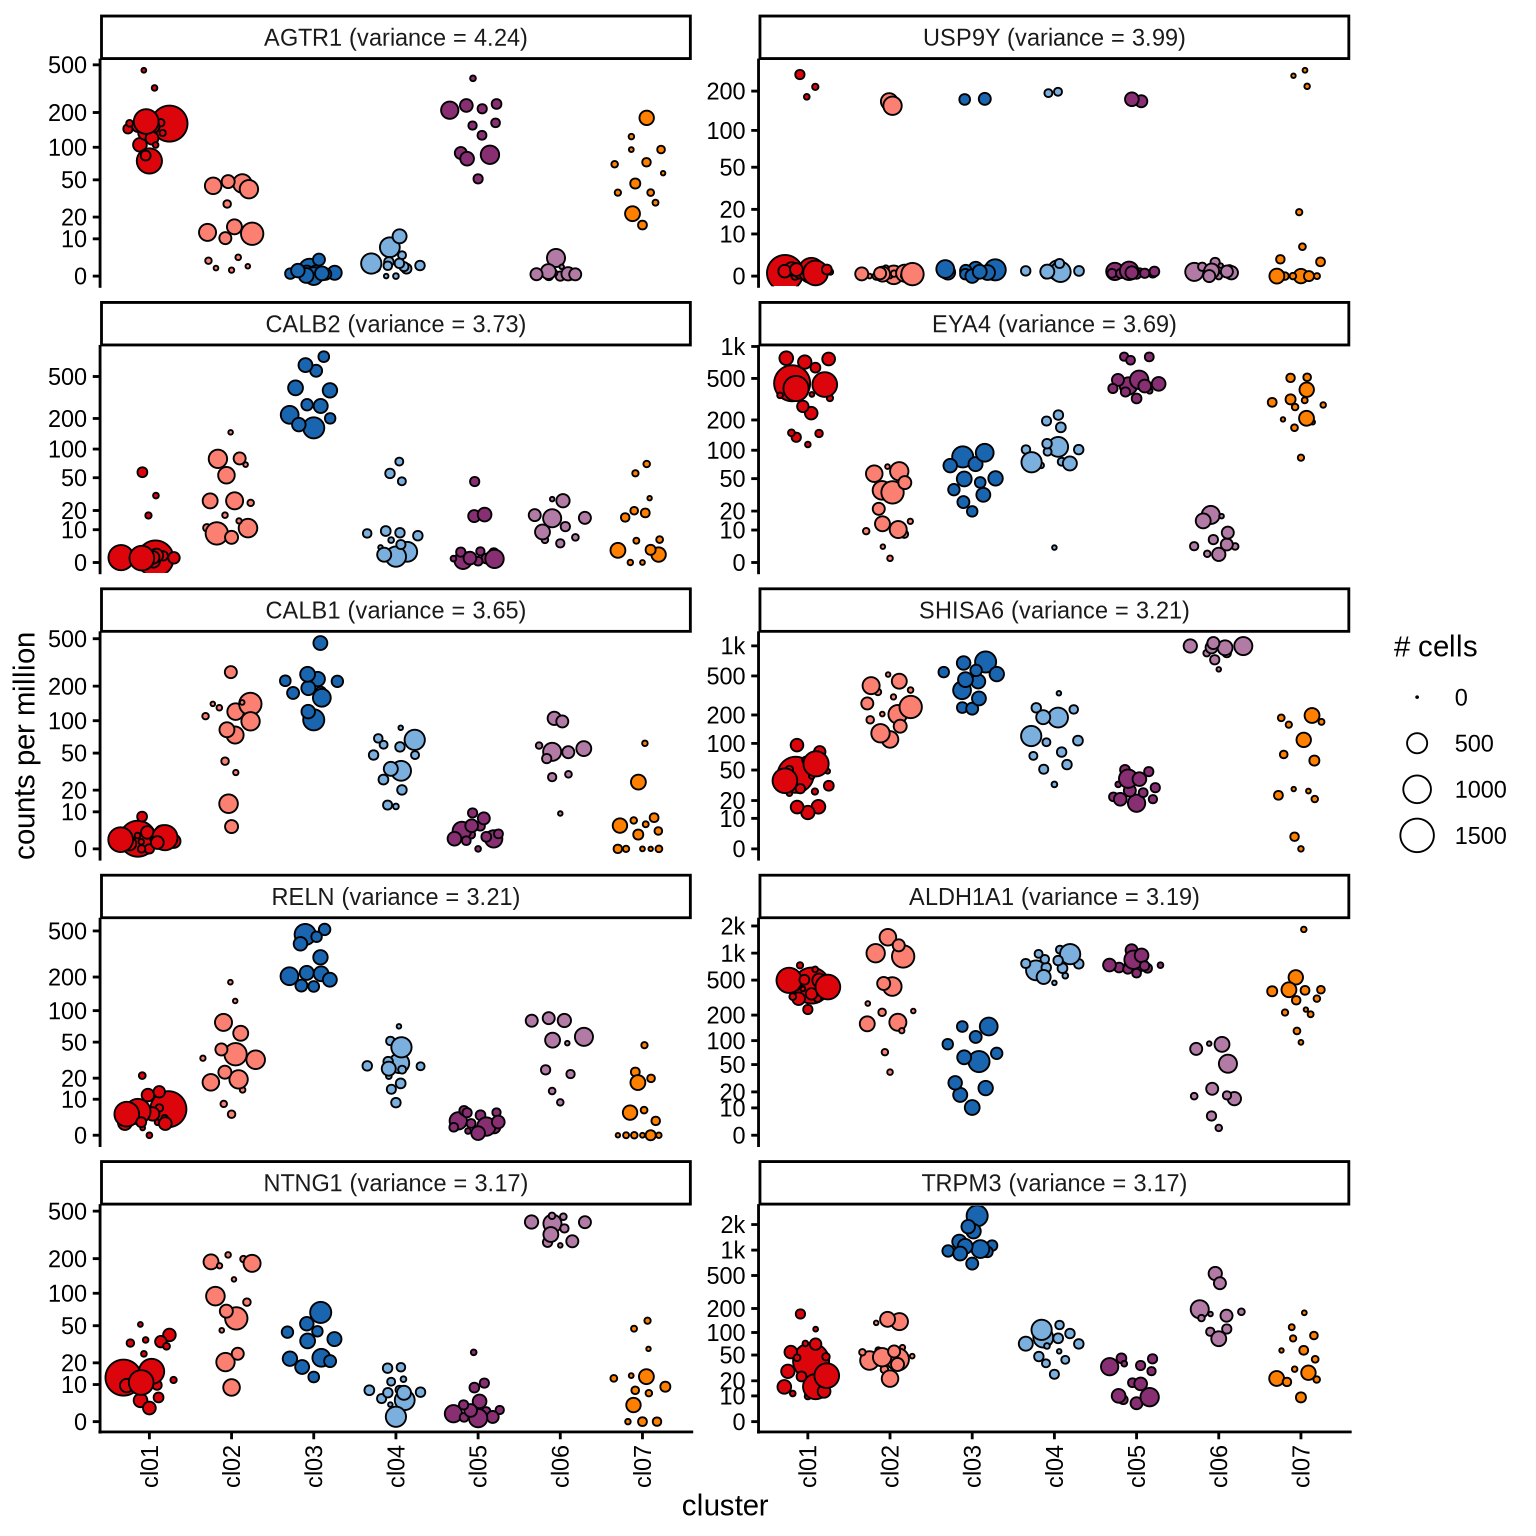
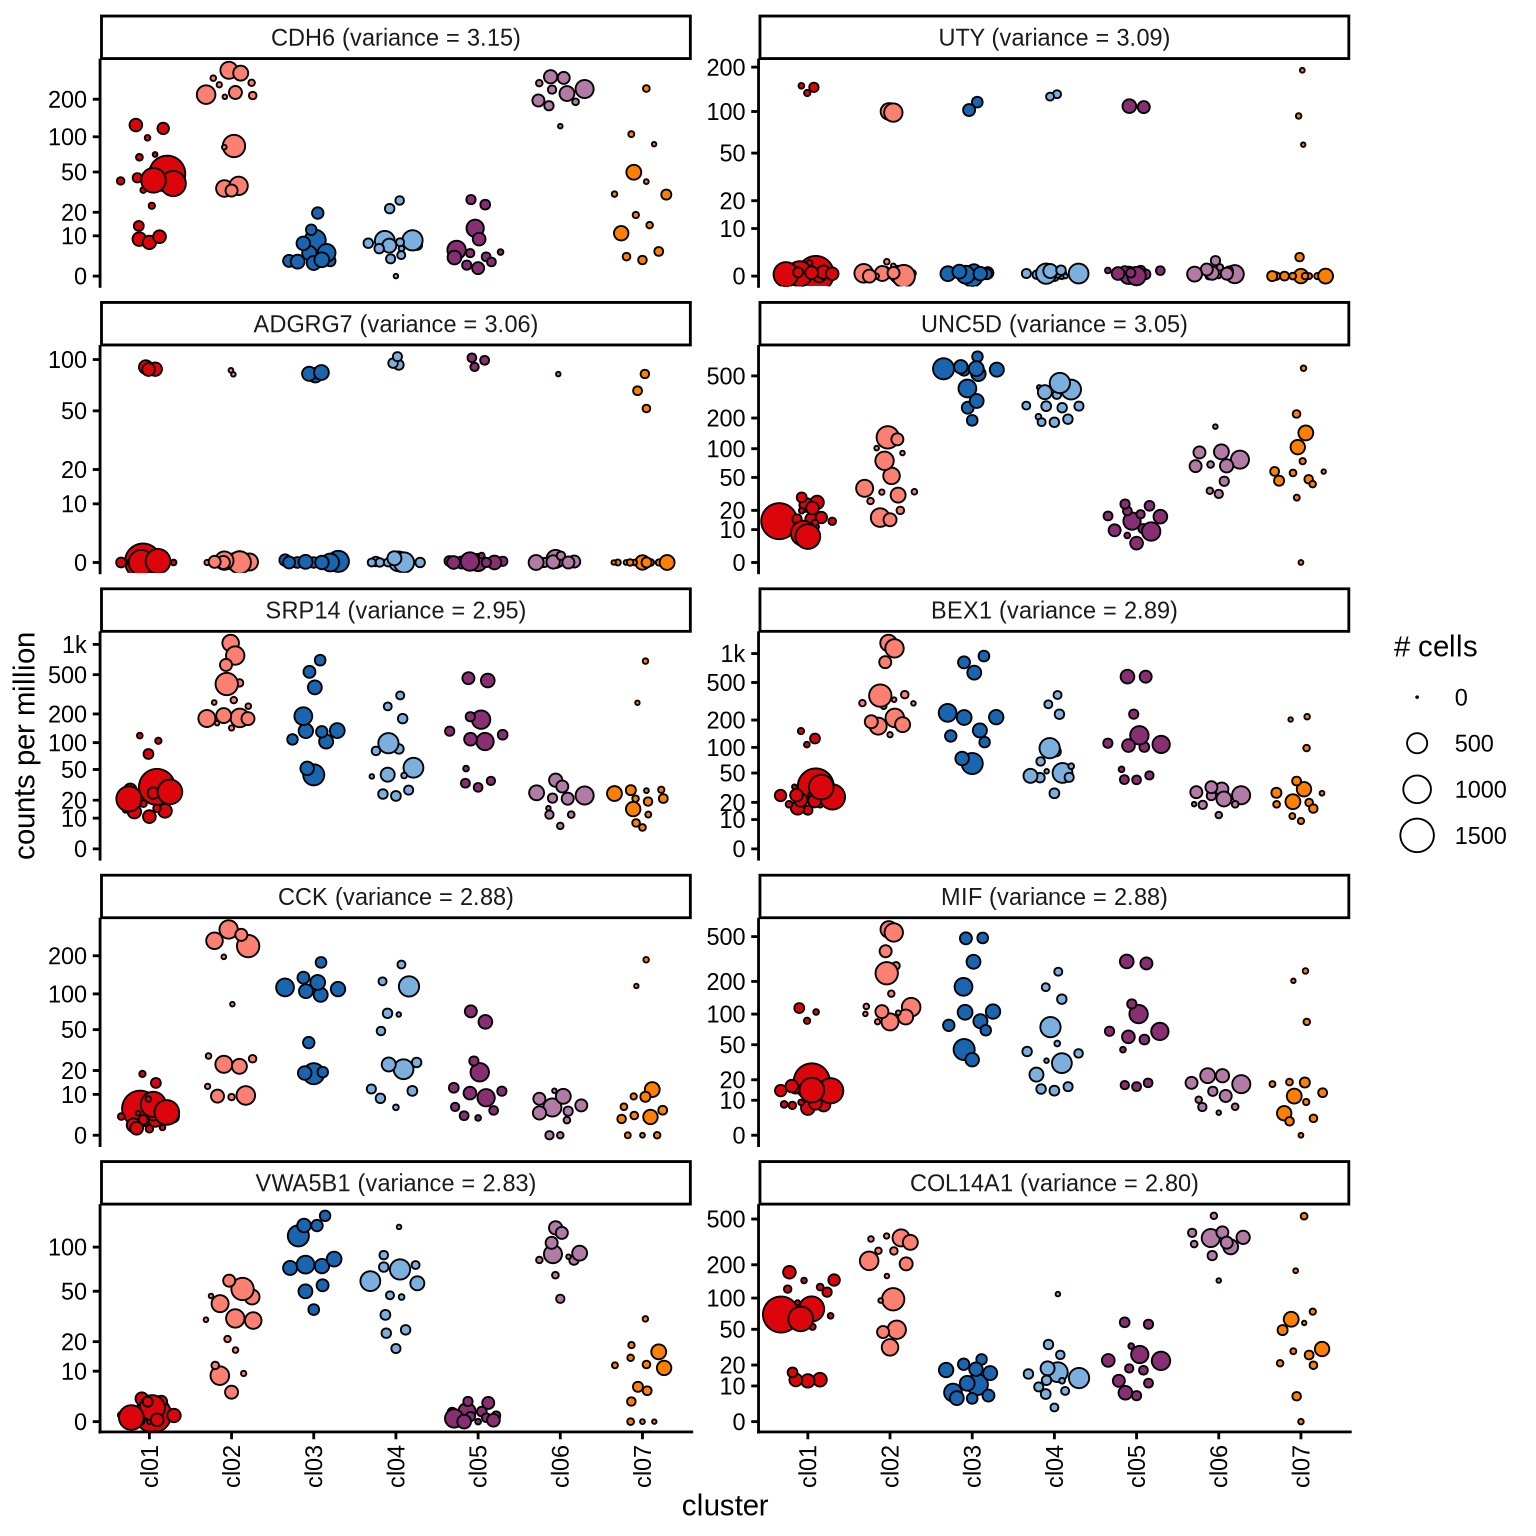
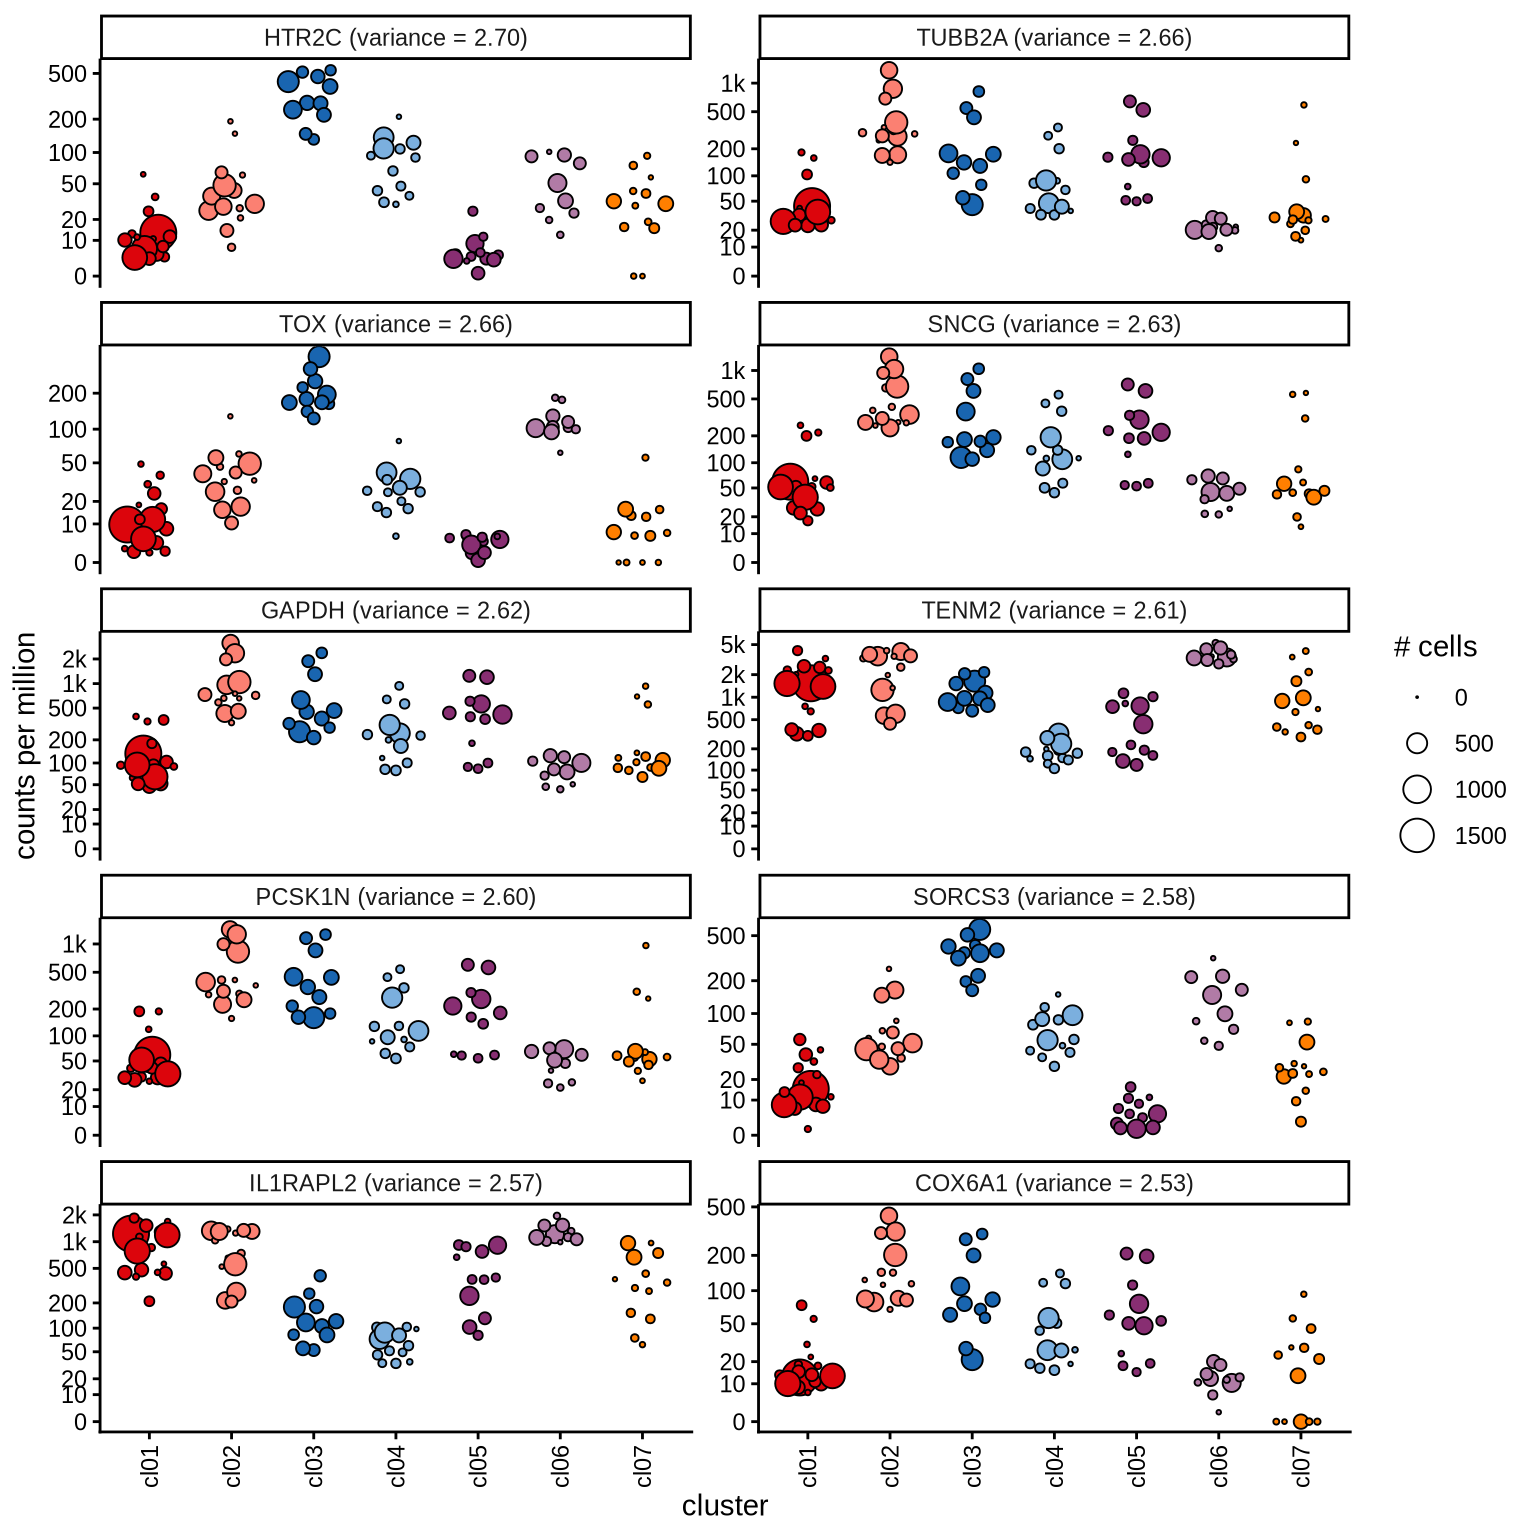
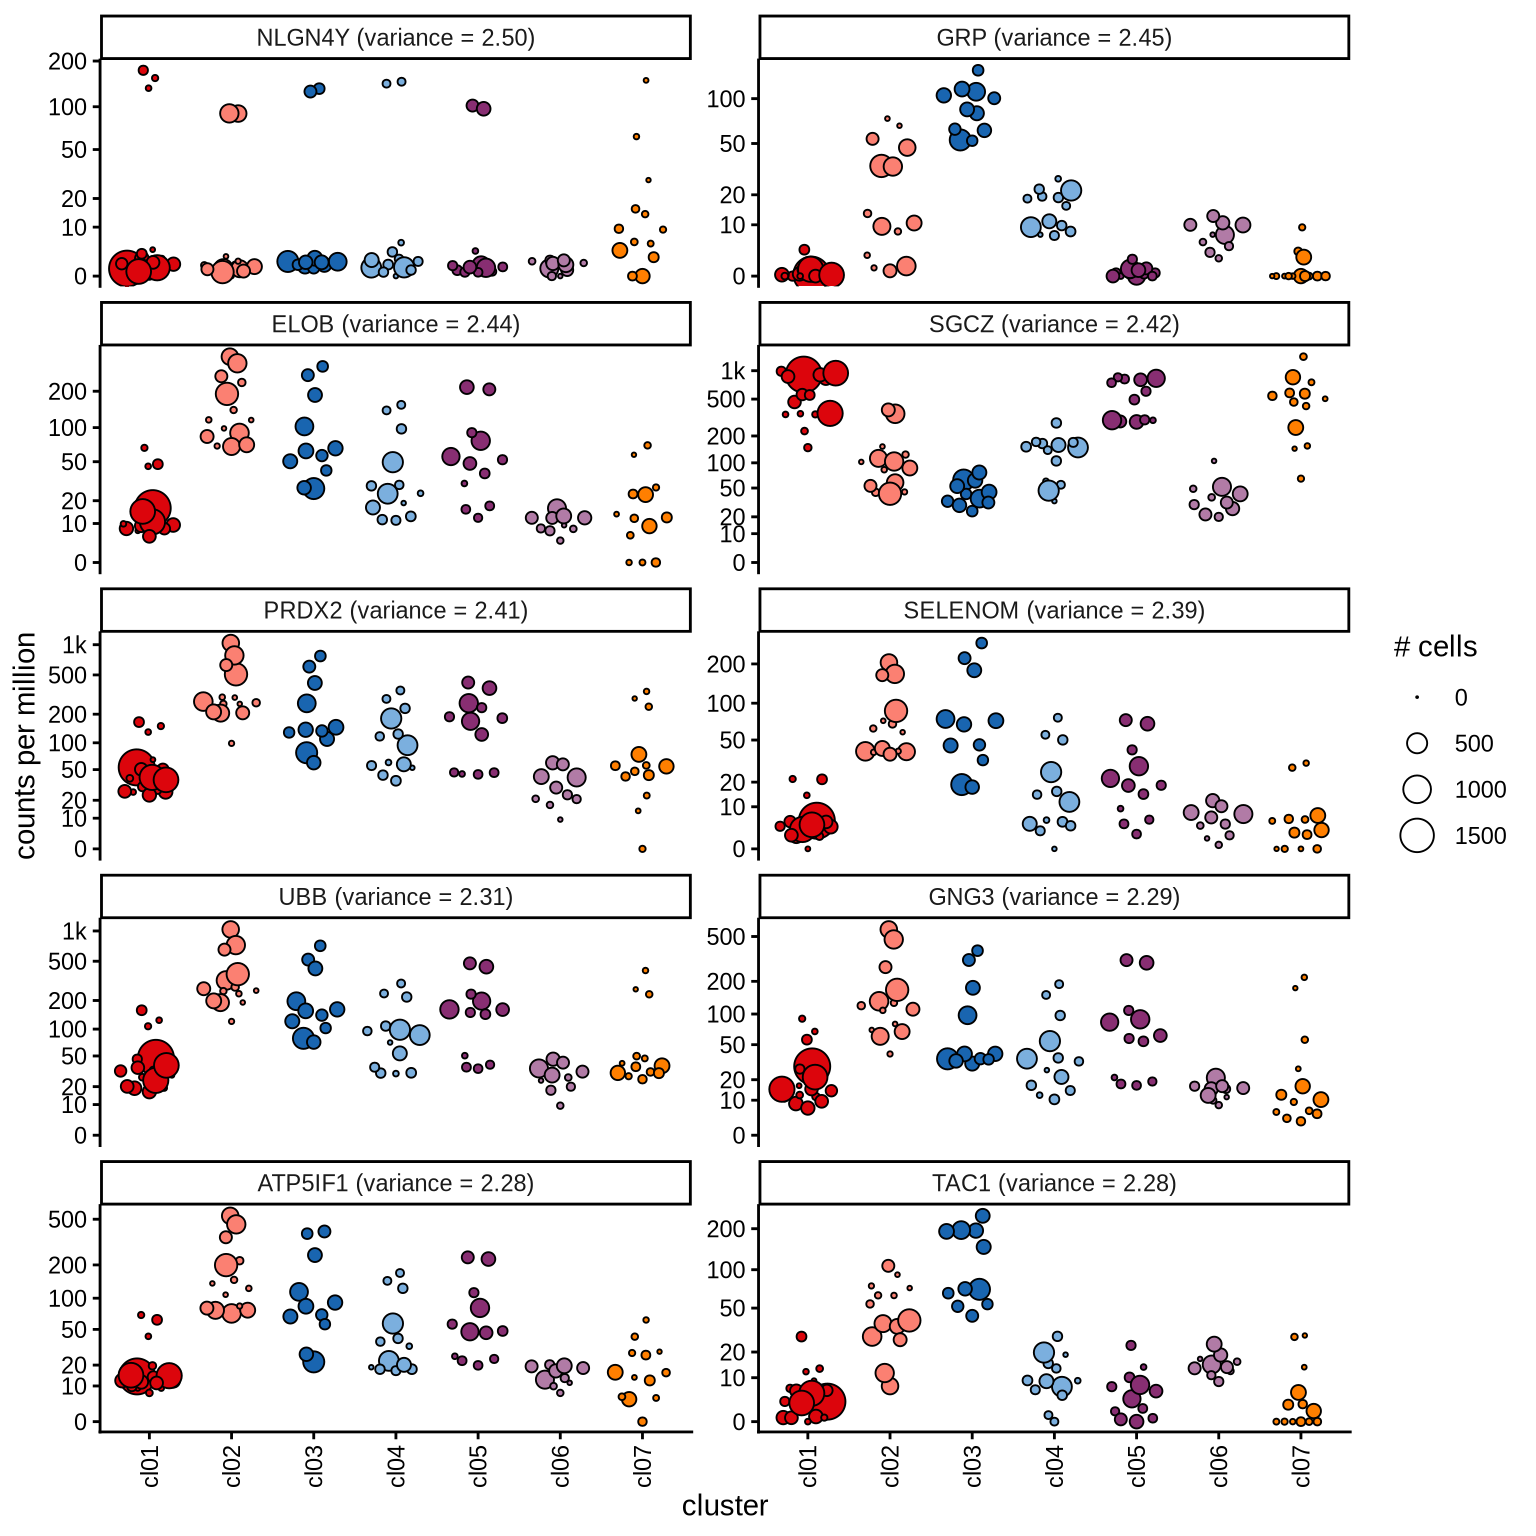
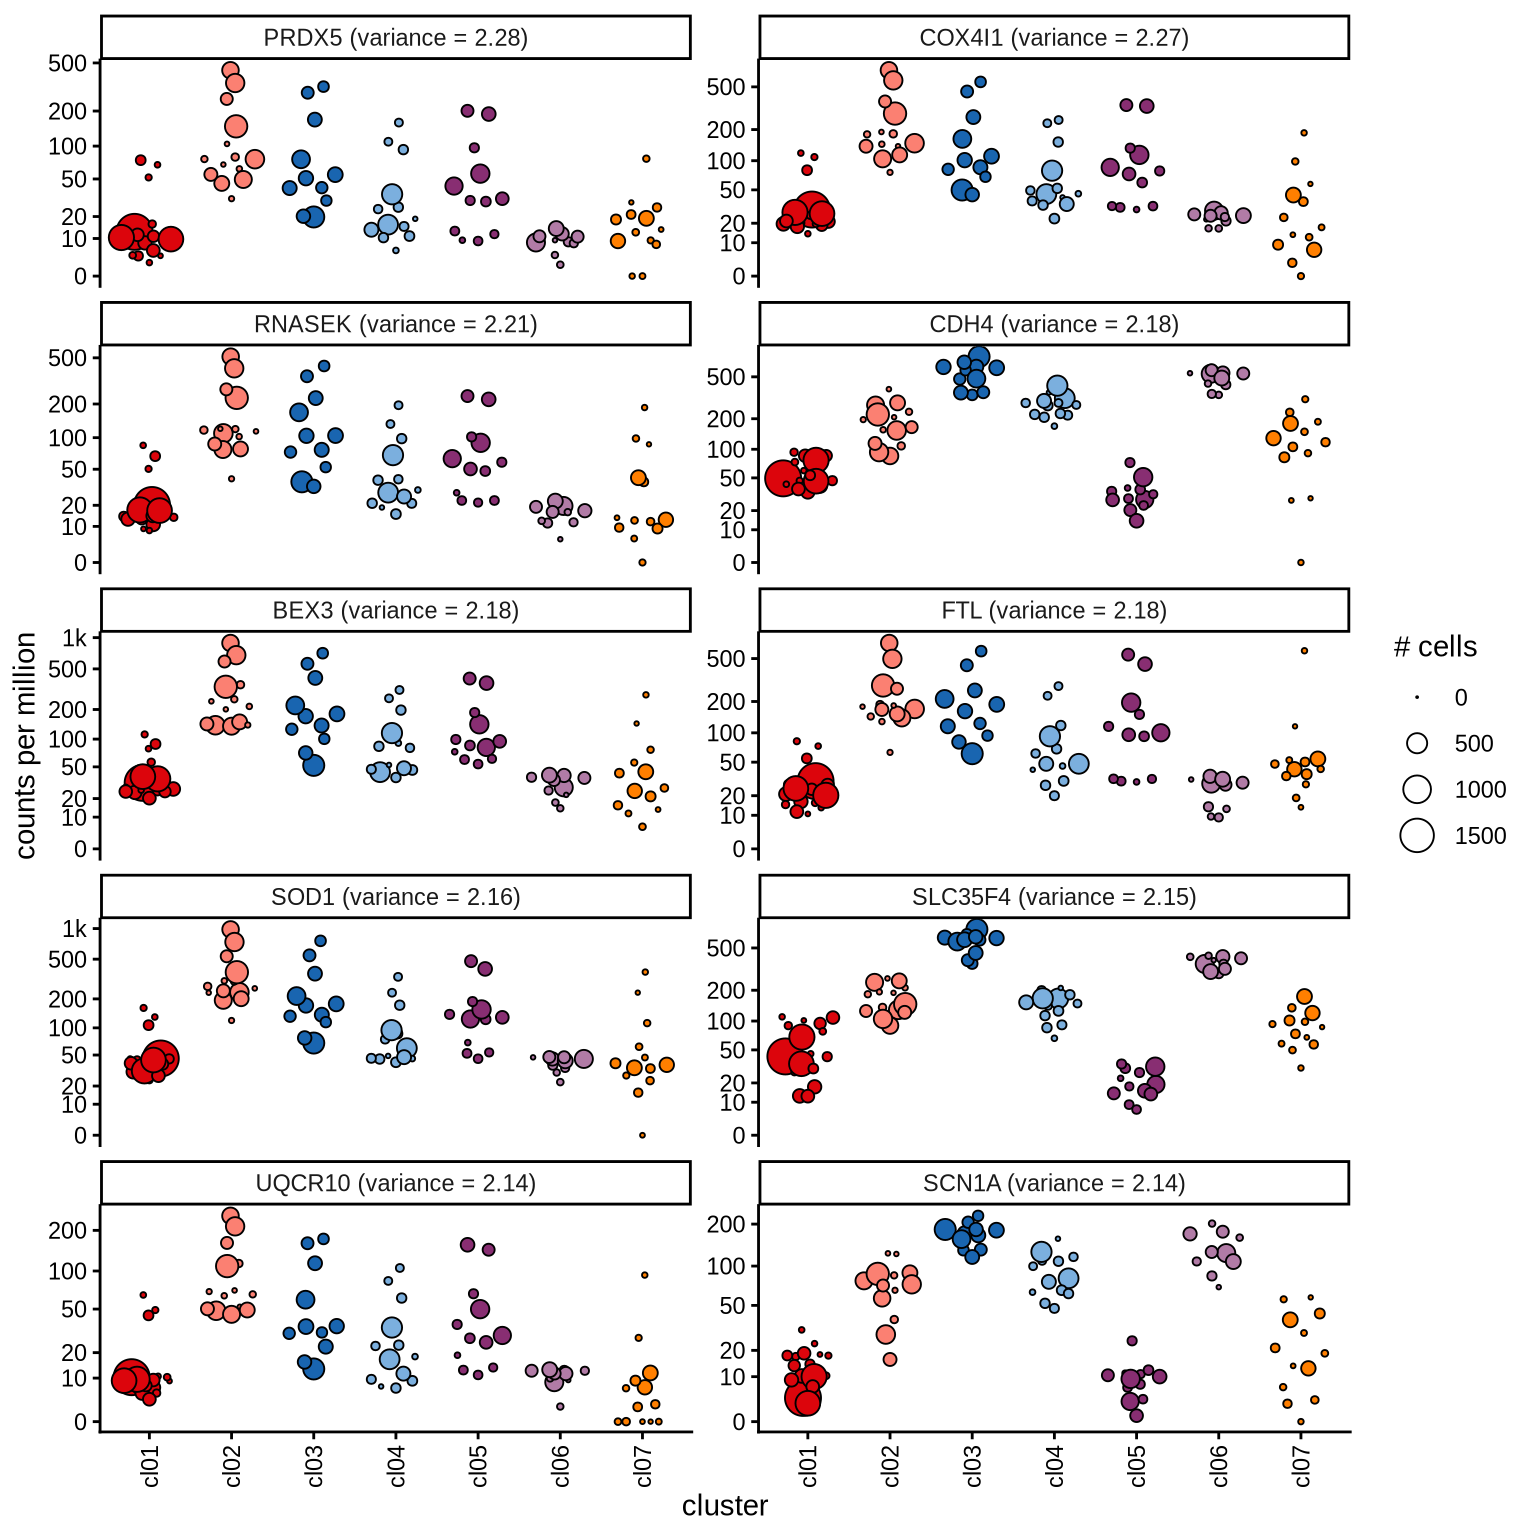
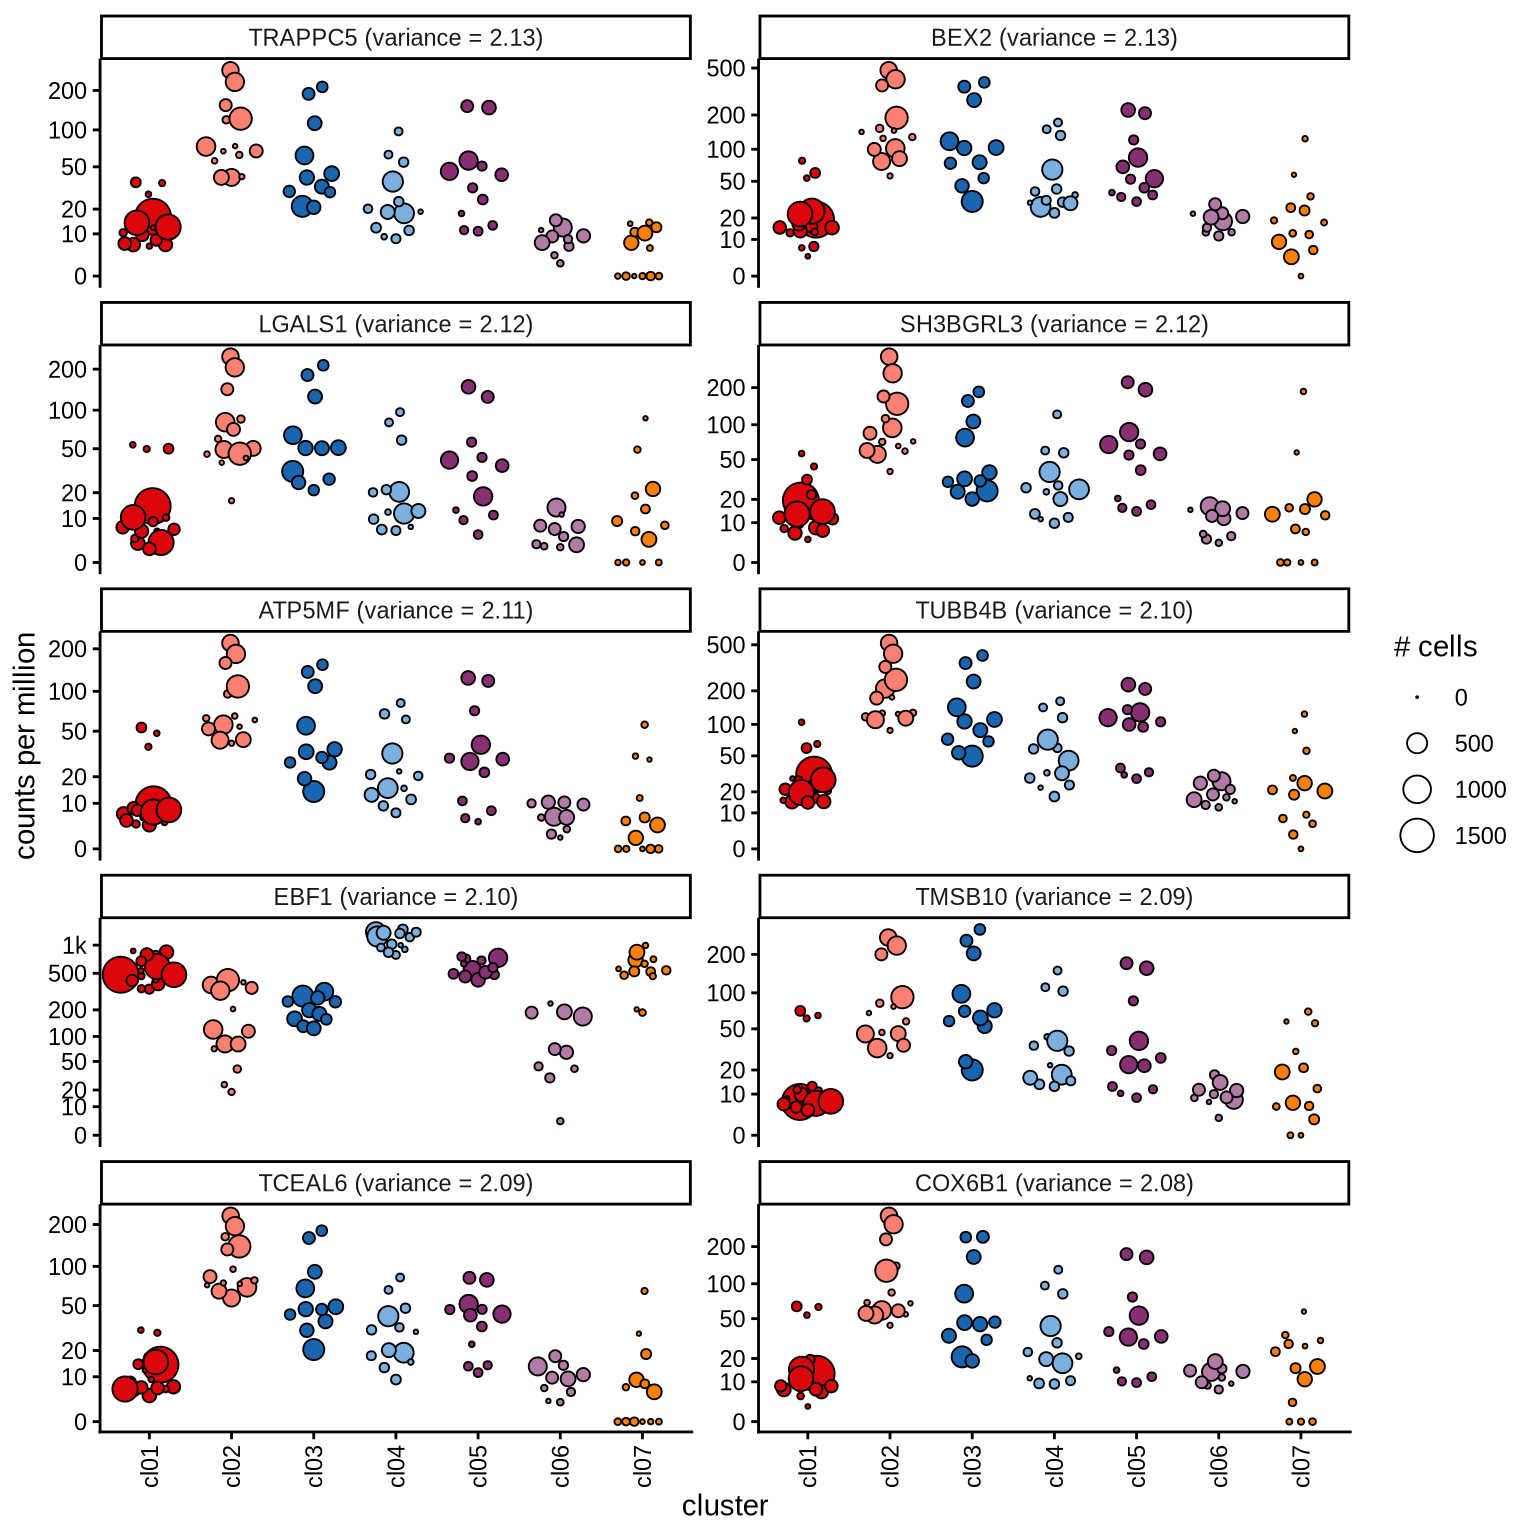
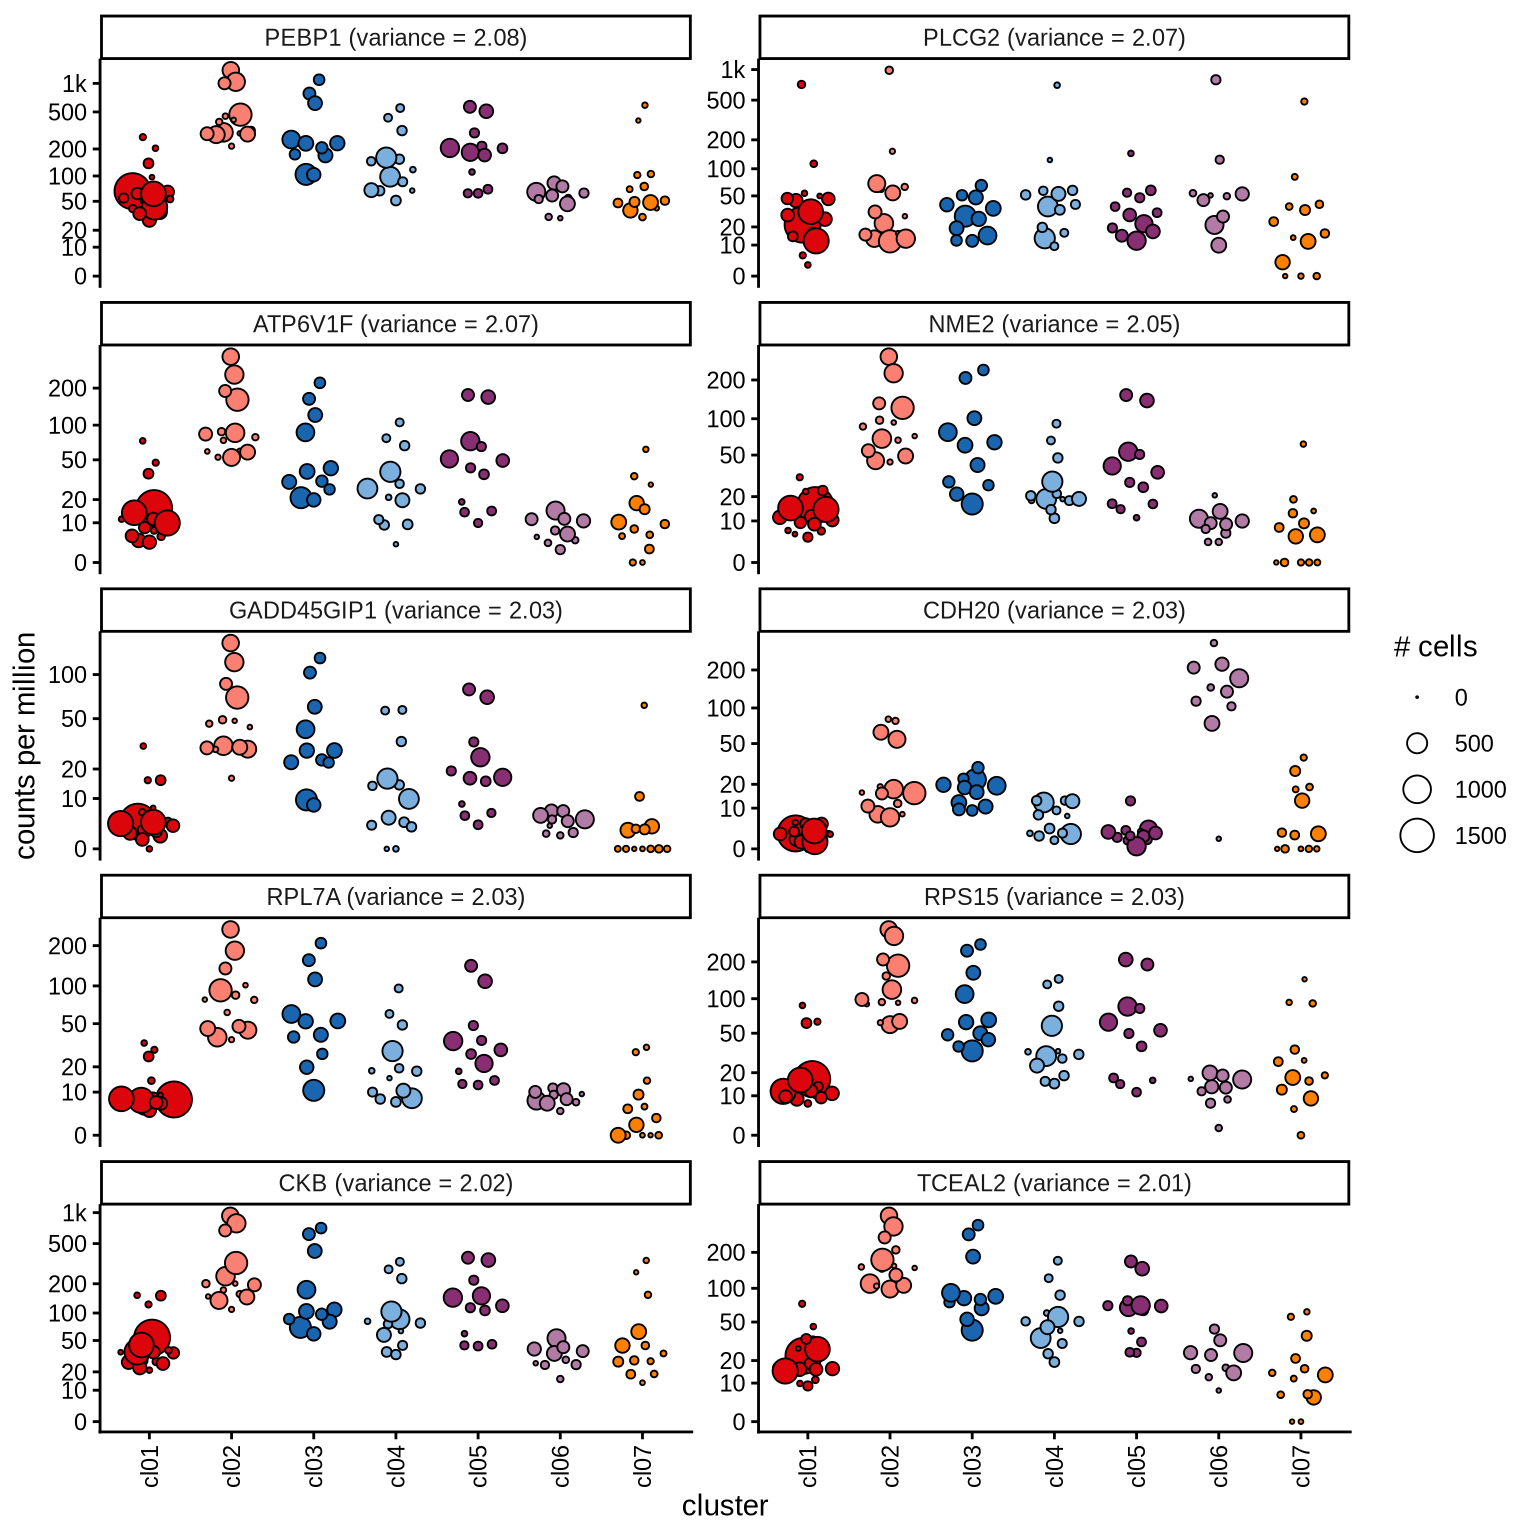
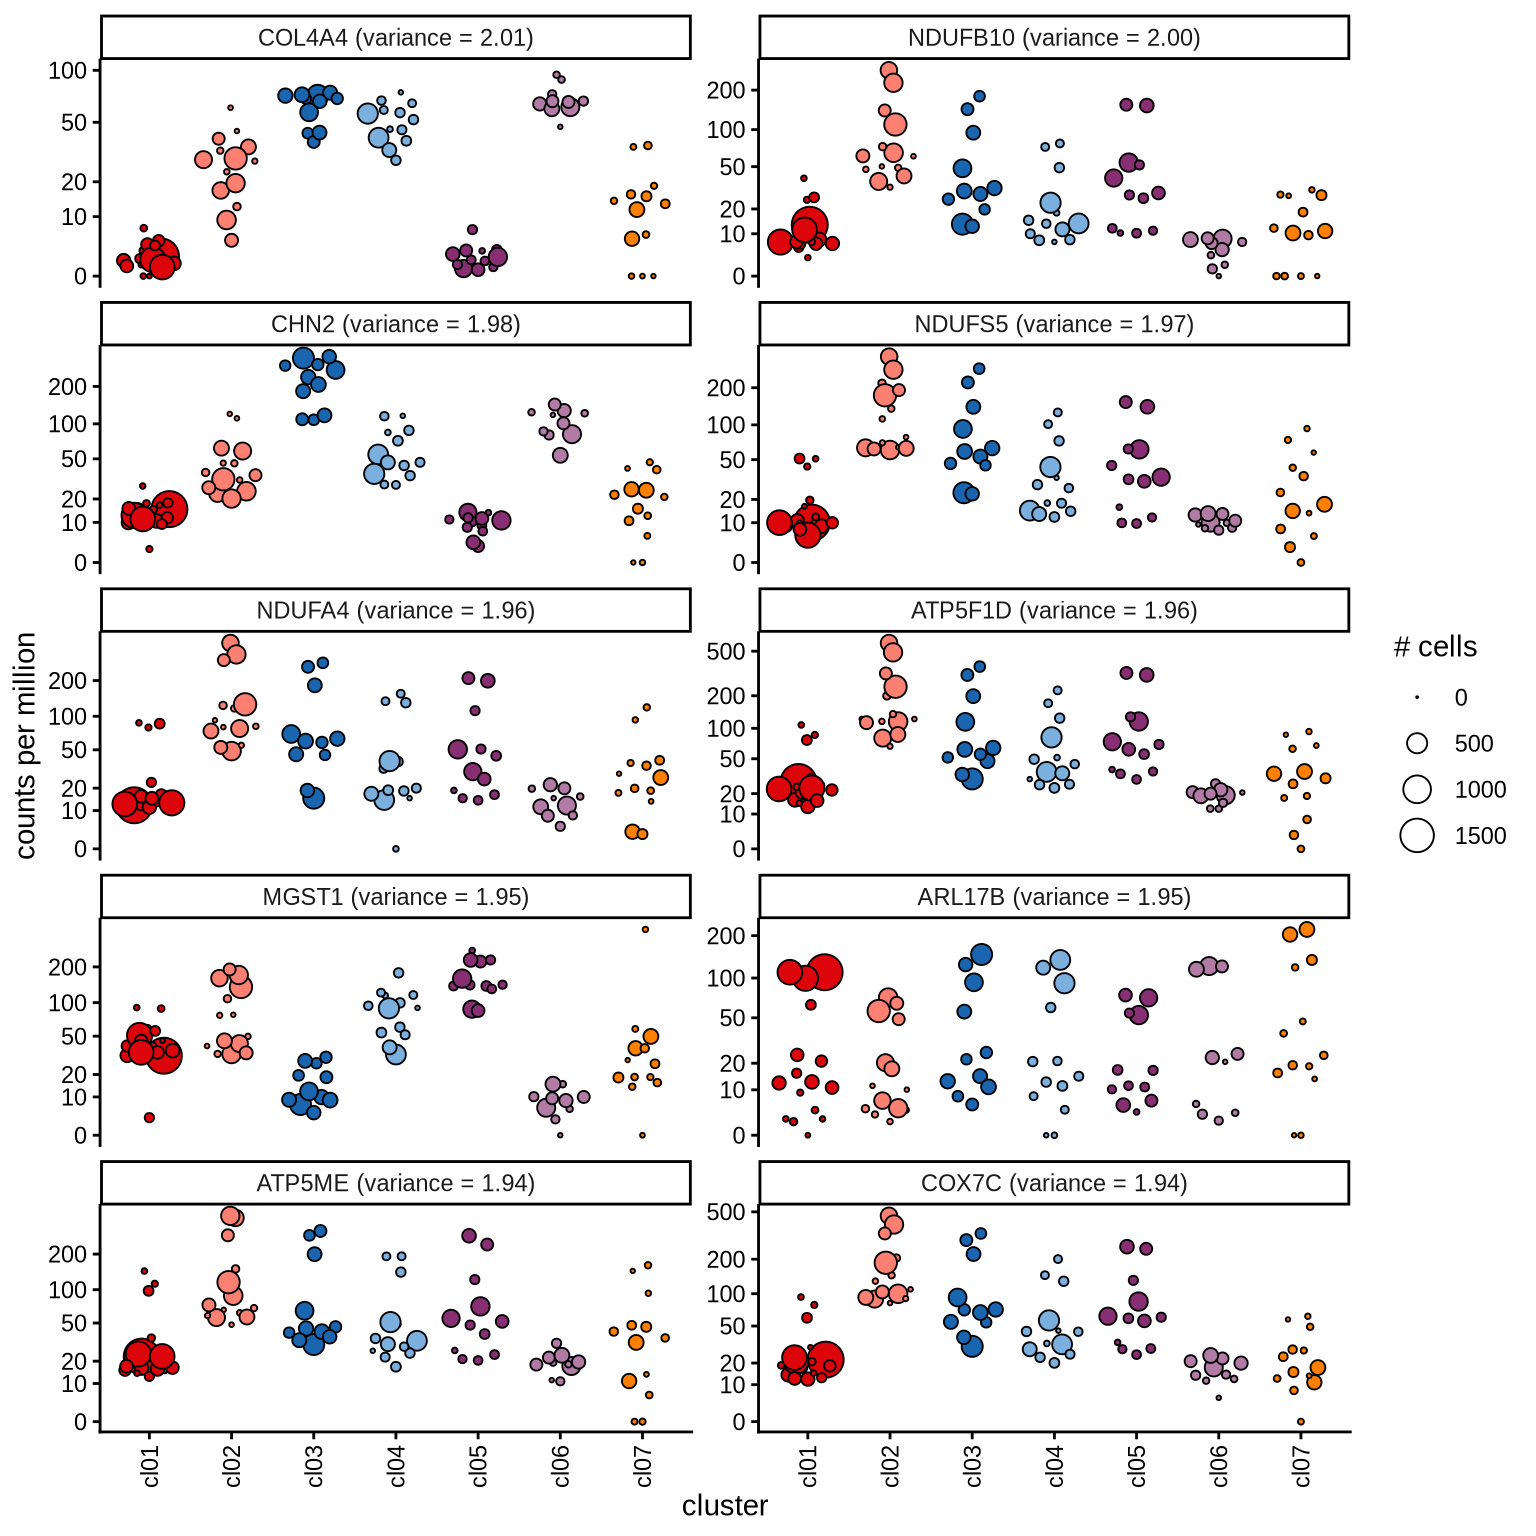
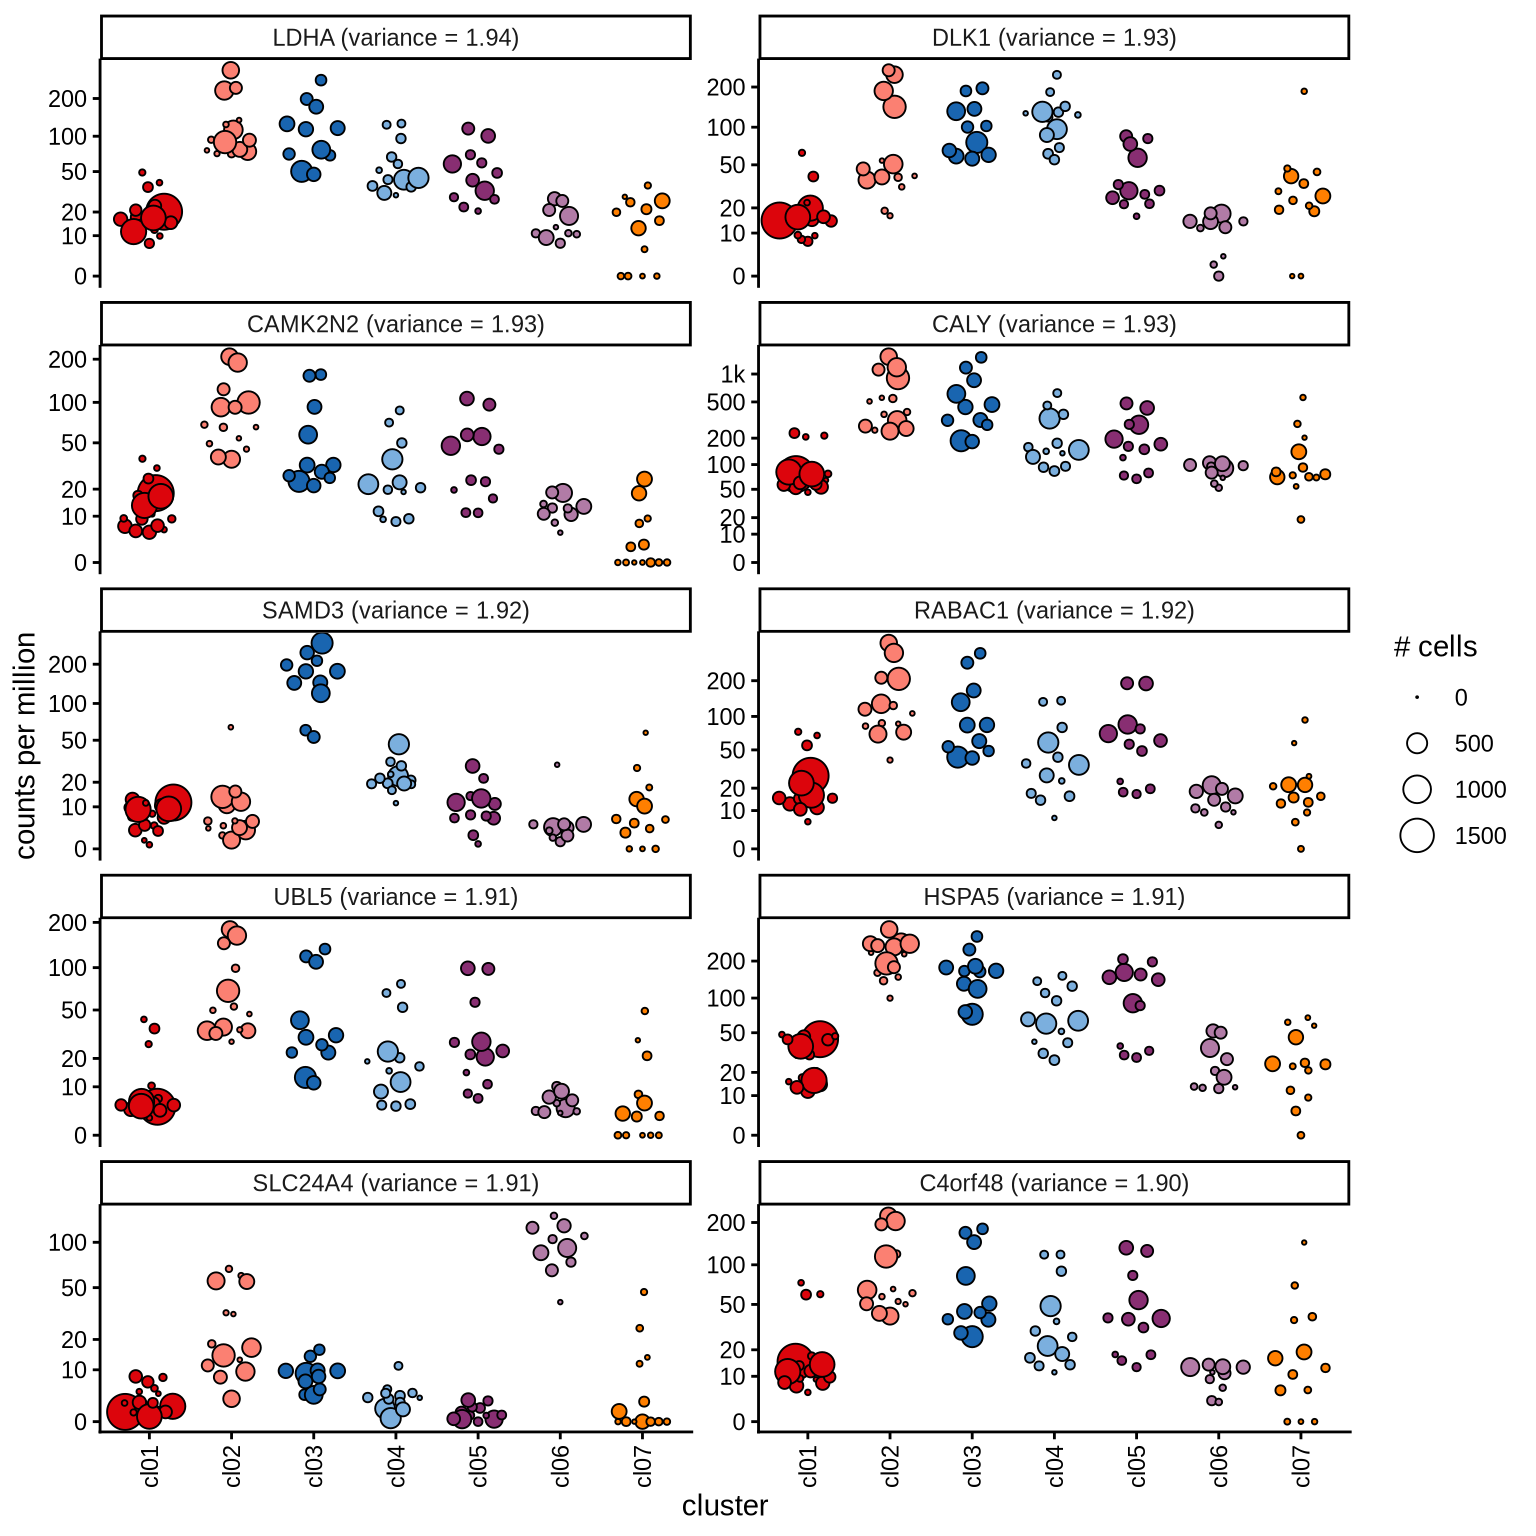
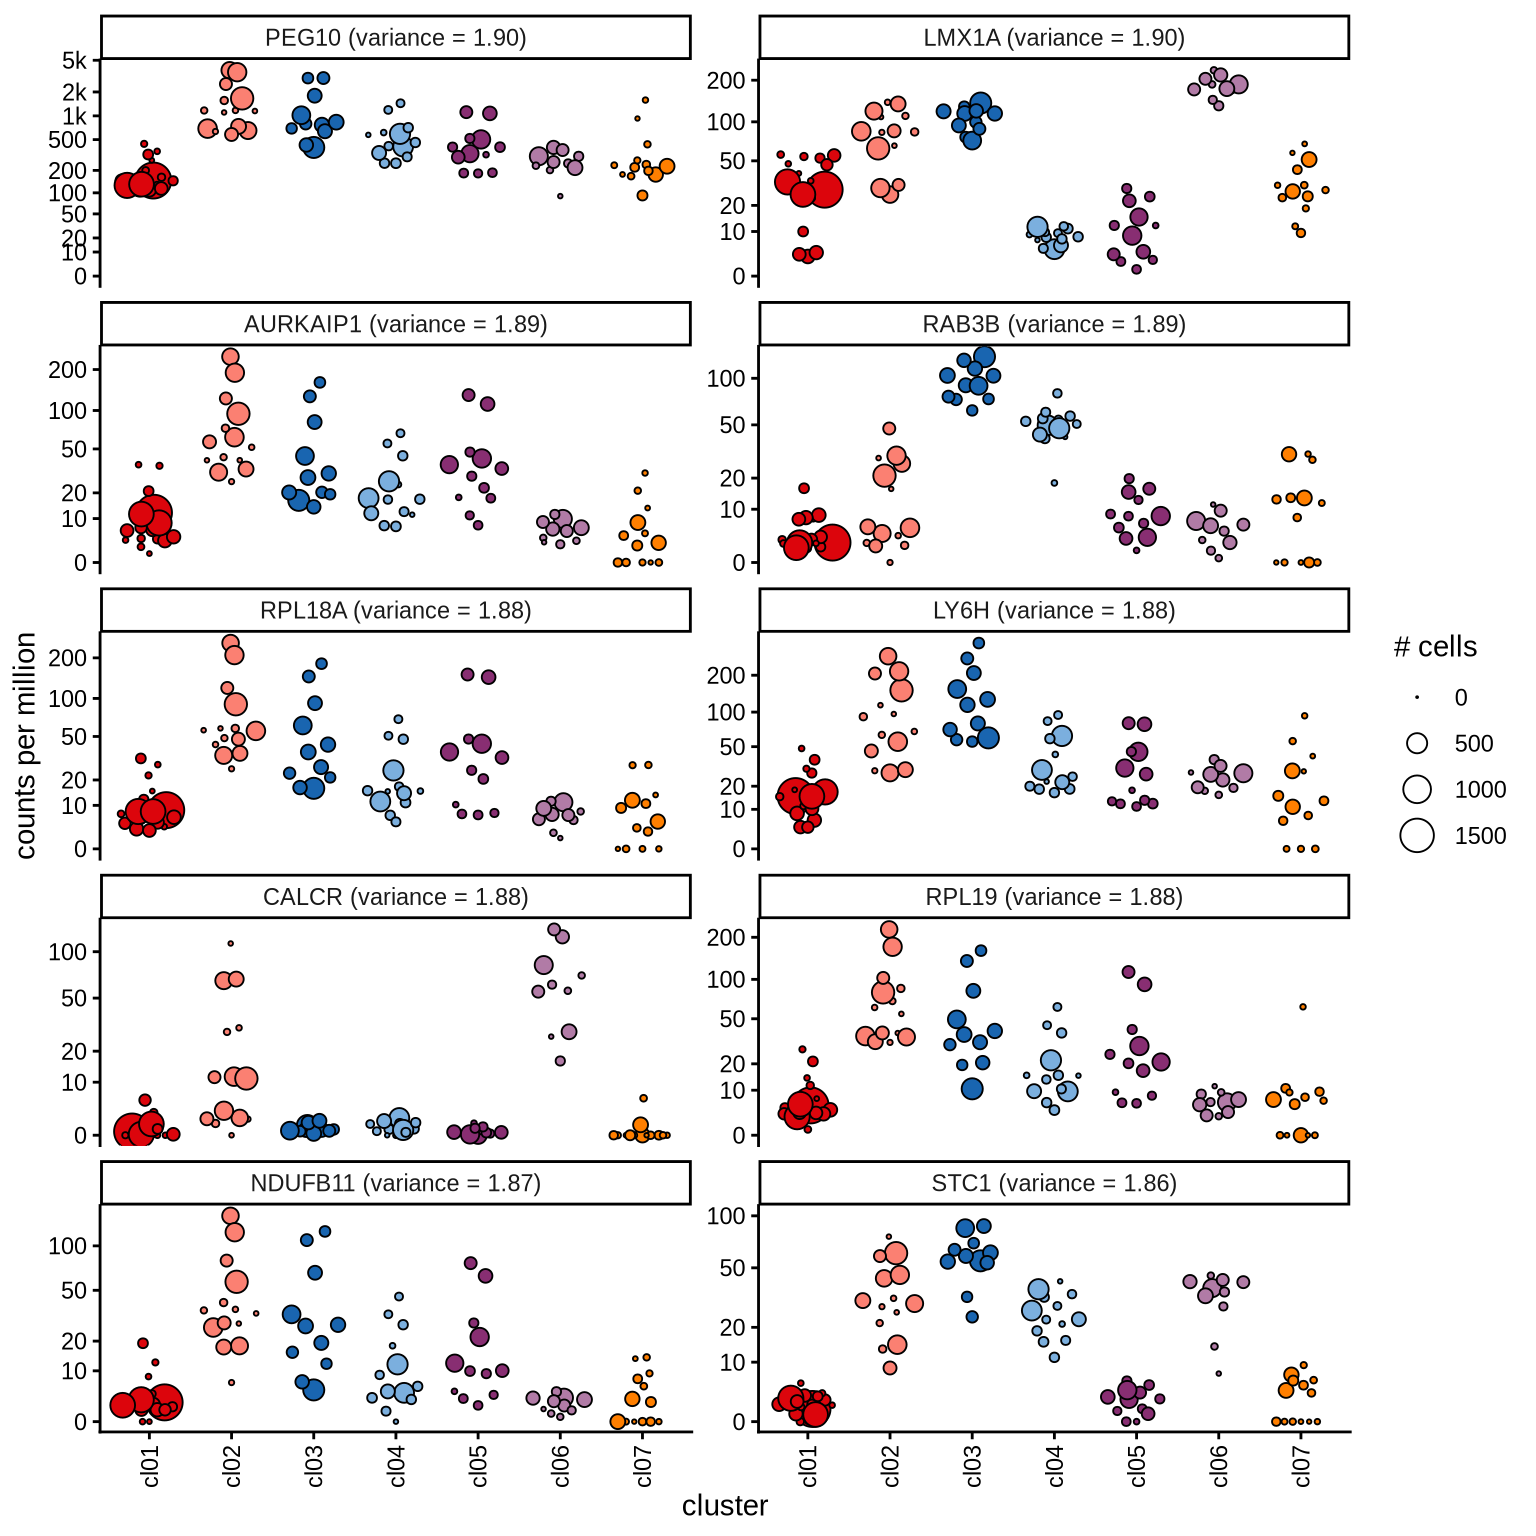
Highly variable genes
Normalized pseudobulk expression values for top 100 highly variable
genes are shown for each cluster, in descending order of variance
(variance calculated using DESeq2::vst).
n_pages = 10
per_p   = 10
p       = 1
for (i in seq(1, n_pages * per_p, by = per_p)) {
  cat('#### page', p, '\n'); p = p + 1
  sel_hvgs  = pb_hvgs_dt[ i:(i + 9) ]
  print(plot_selected_genes(sel_hvgs, cpms_dt, cl_order = cl_ord))
  cat('\n\n')
}
page 1
page 2
page 3
page 4
page 5
page 6
page 7
page 8
page 9
page 10
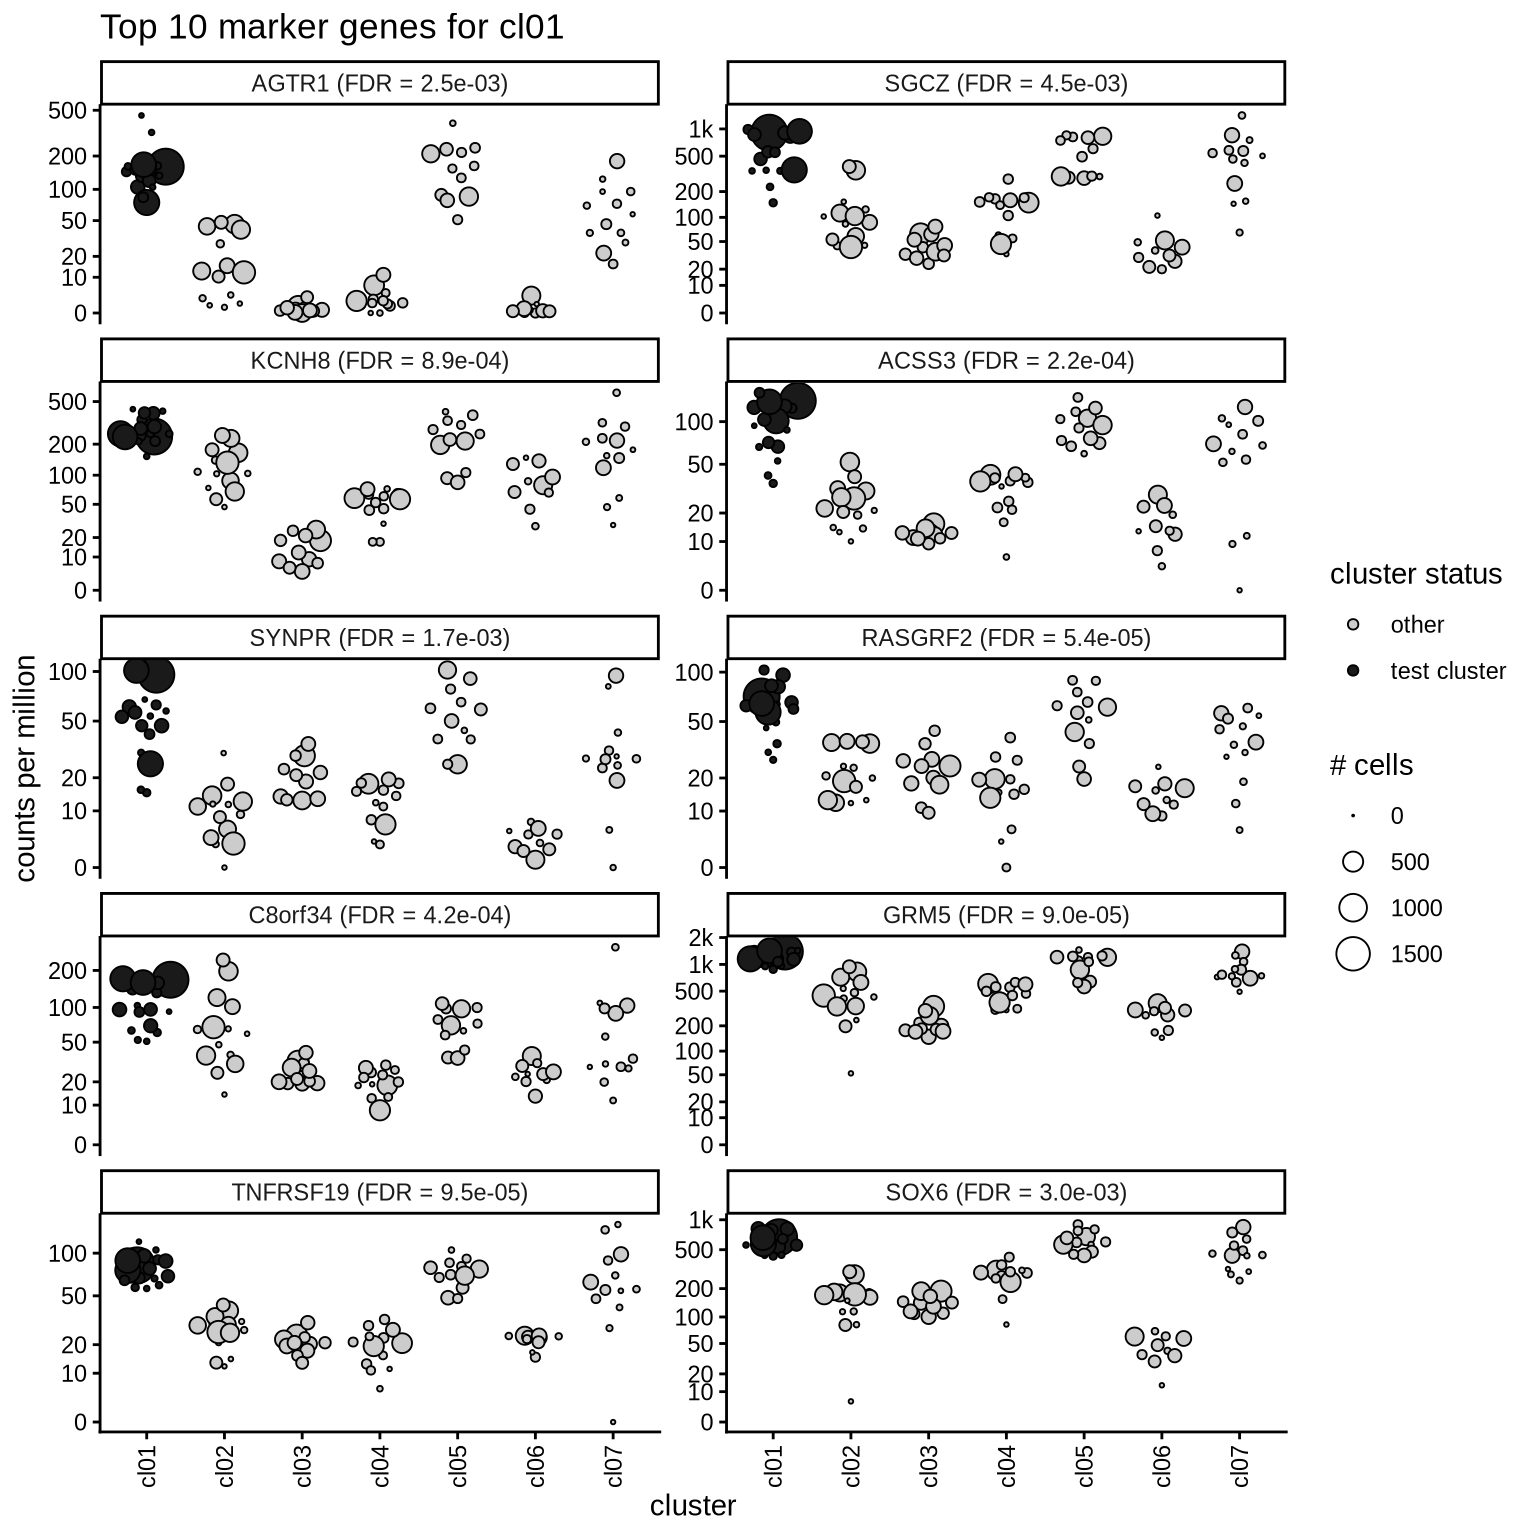
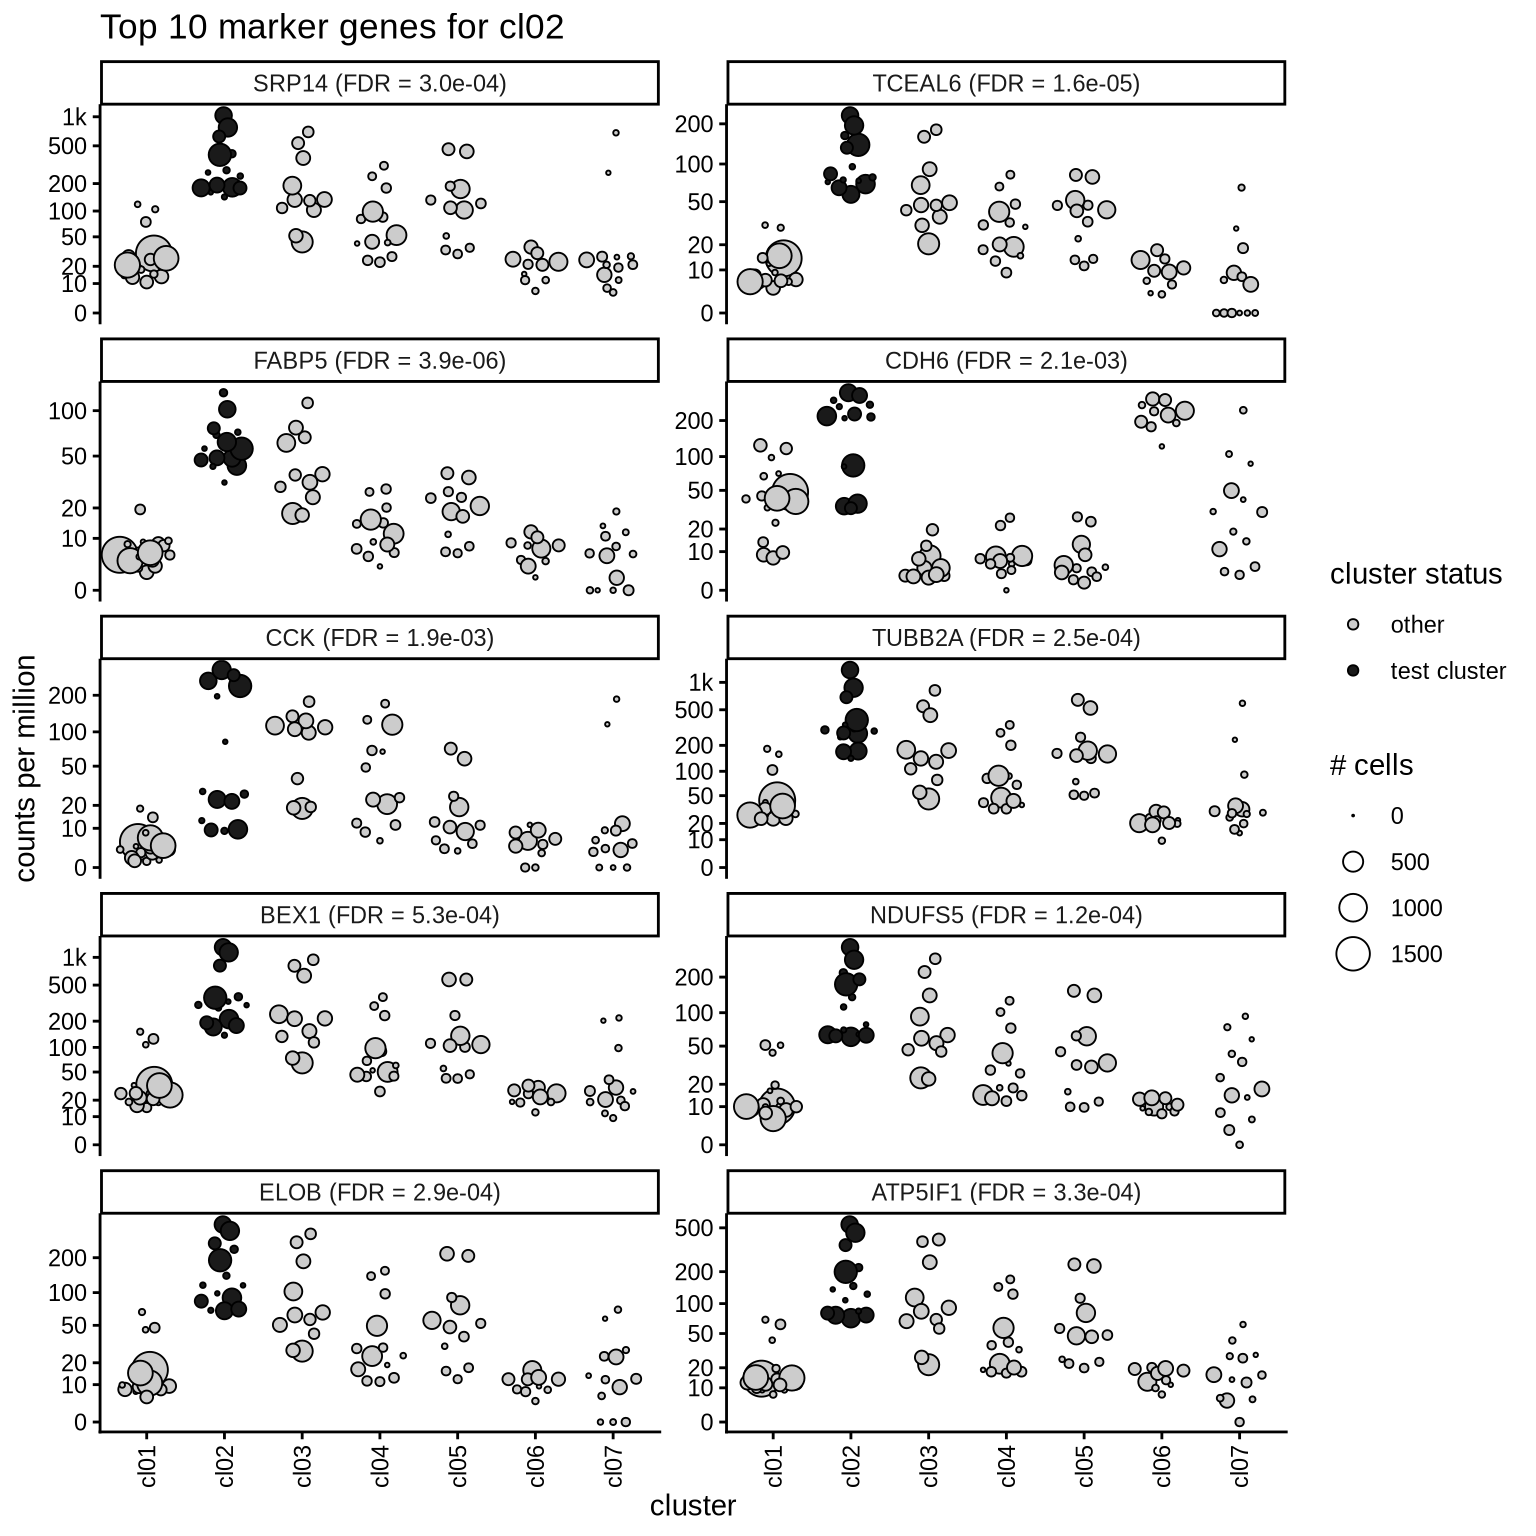
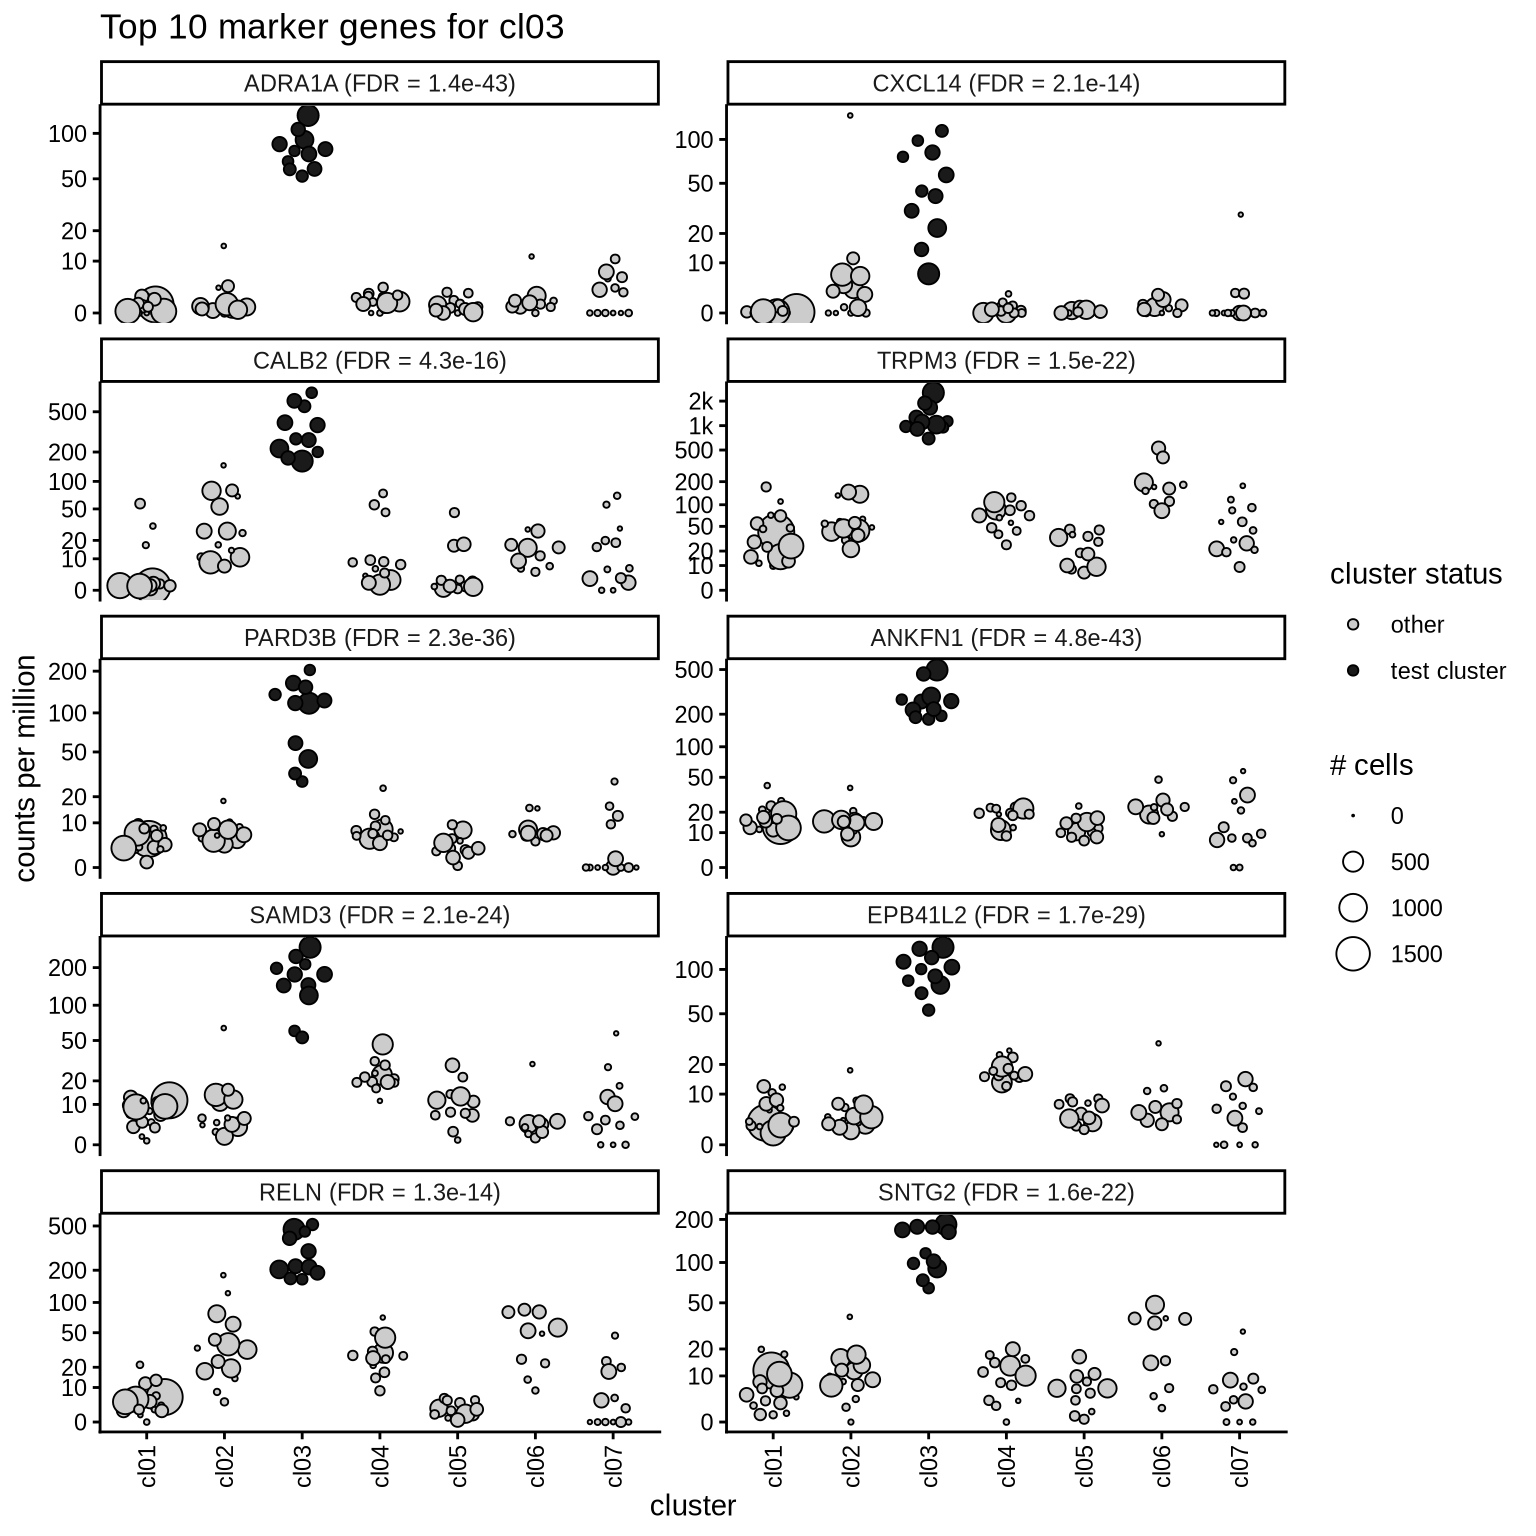
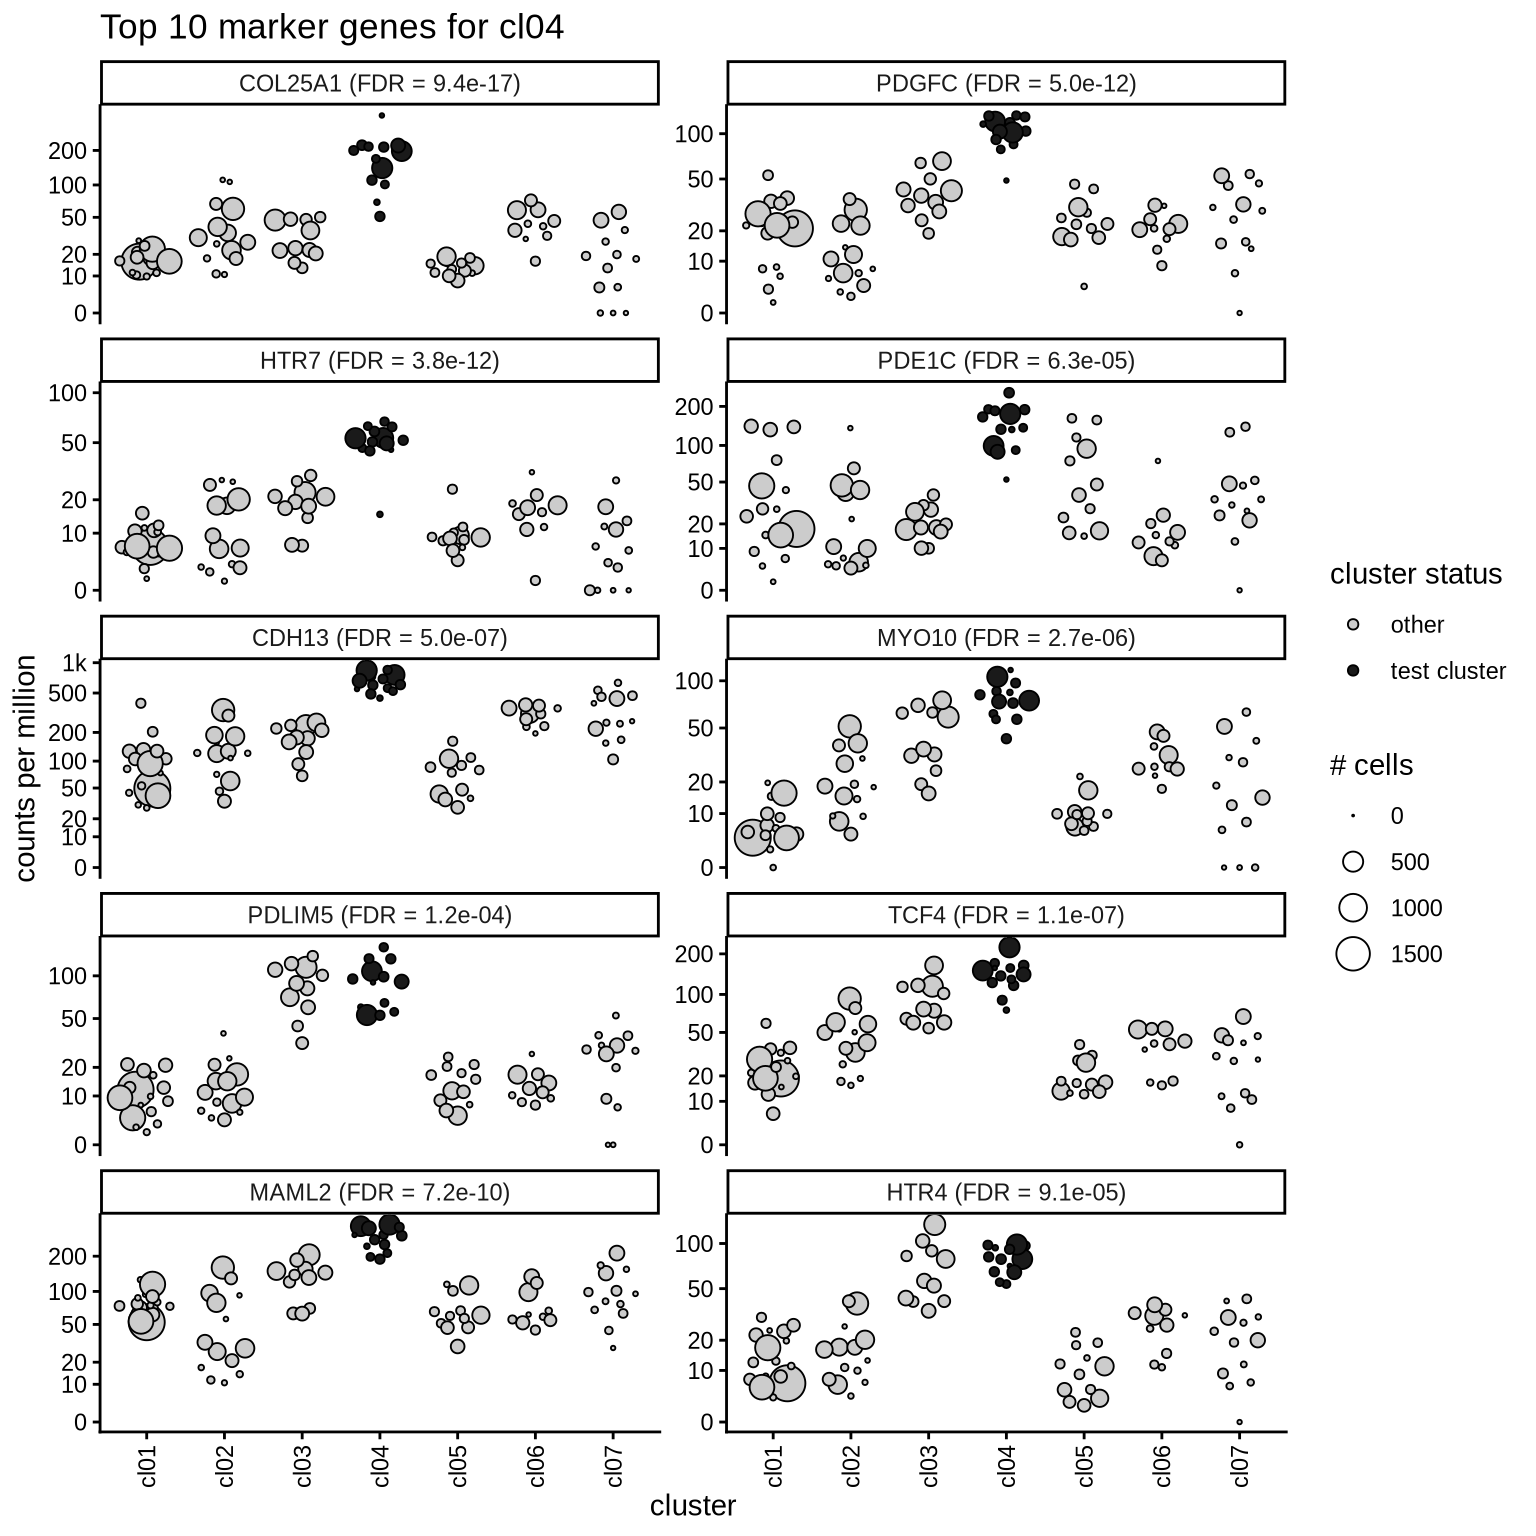
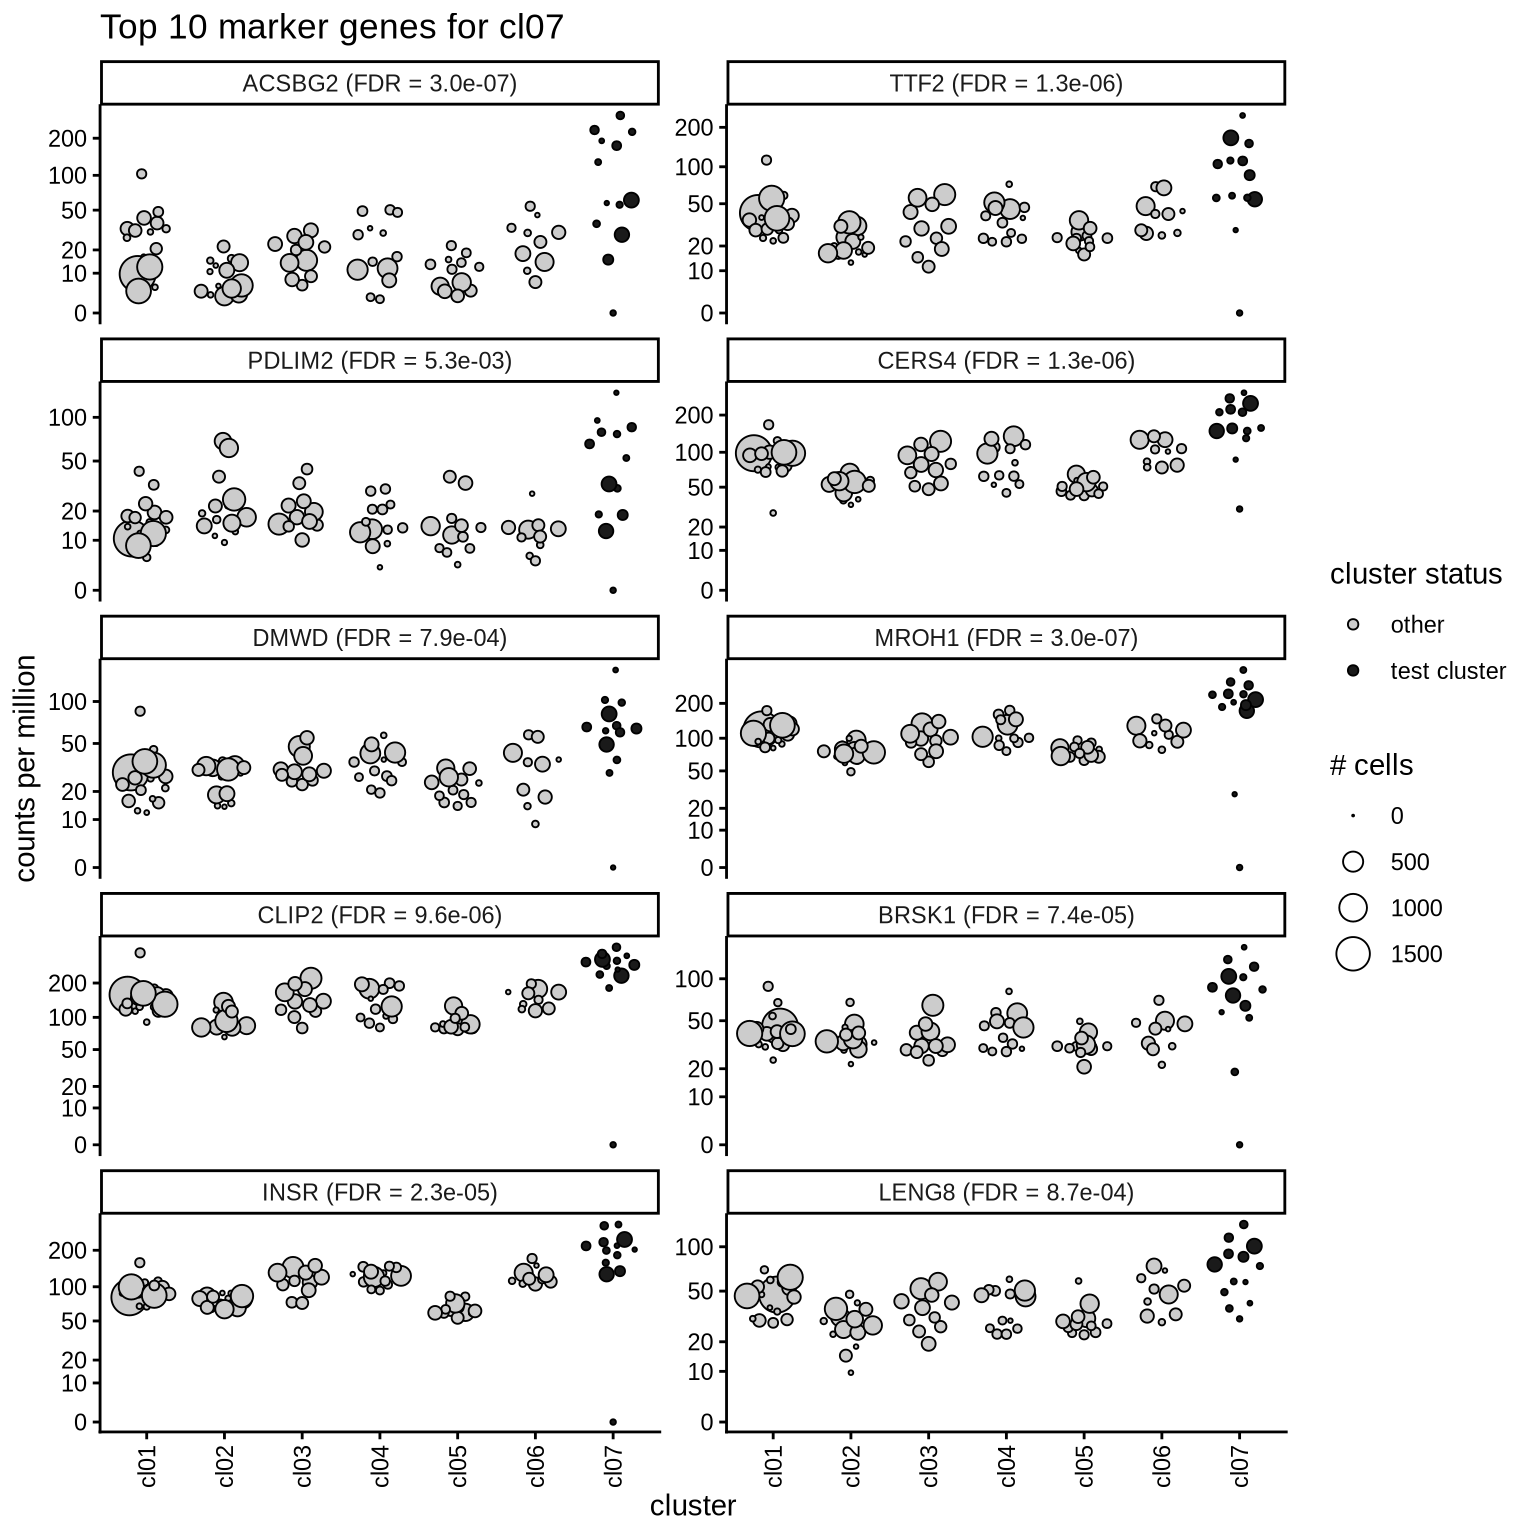
Top marker genes
Normalized pseudobulk expression values of top 10 marker genes with FDR < 0.05 and a minimum expression of 50 CPM are shown for each cluster.
for (sel_cl in cl_ord) {
  cat('####', sel_cl, '\n')
  print(plot_top_marker_genes(sel_cl, top_min_dt, cpms_dt, cl_order = cl_ord))
  cat('\n\n')
}
cl01
cl02
cl03
cl04
cl05
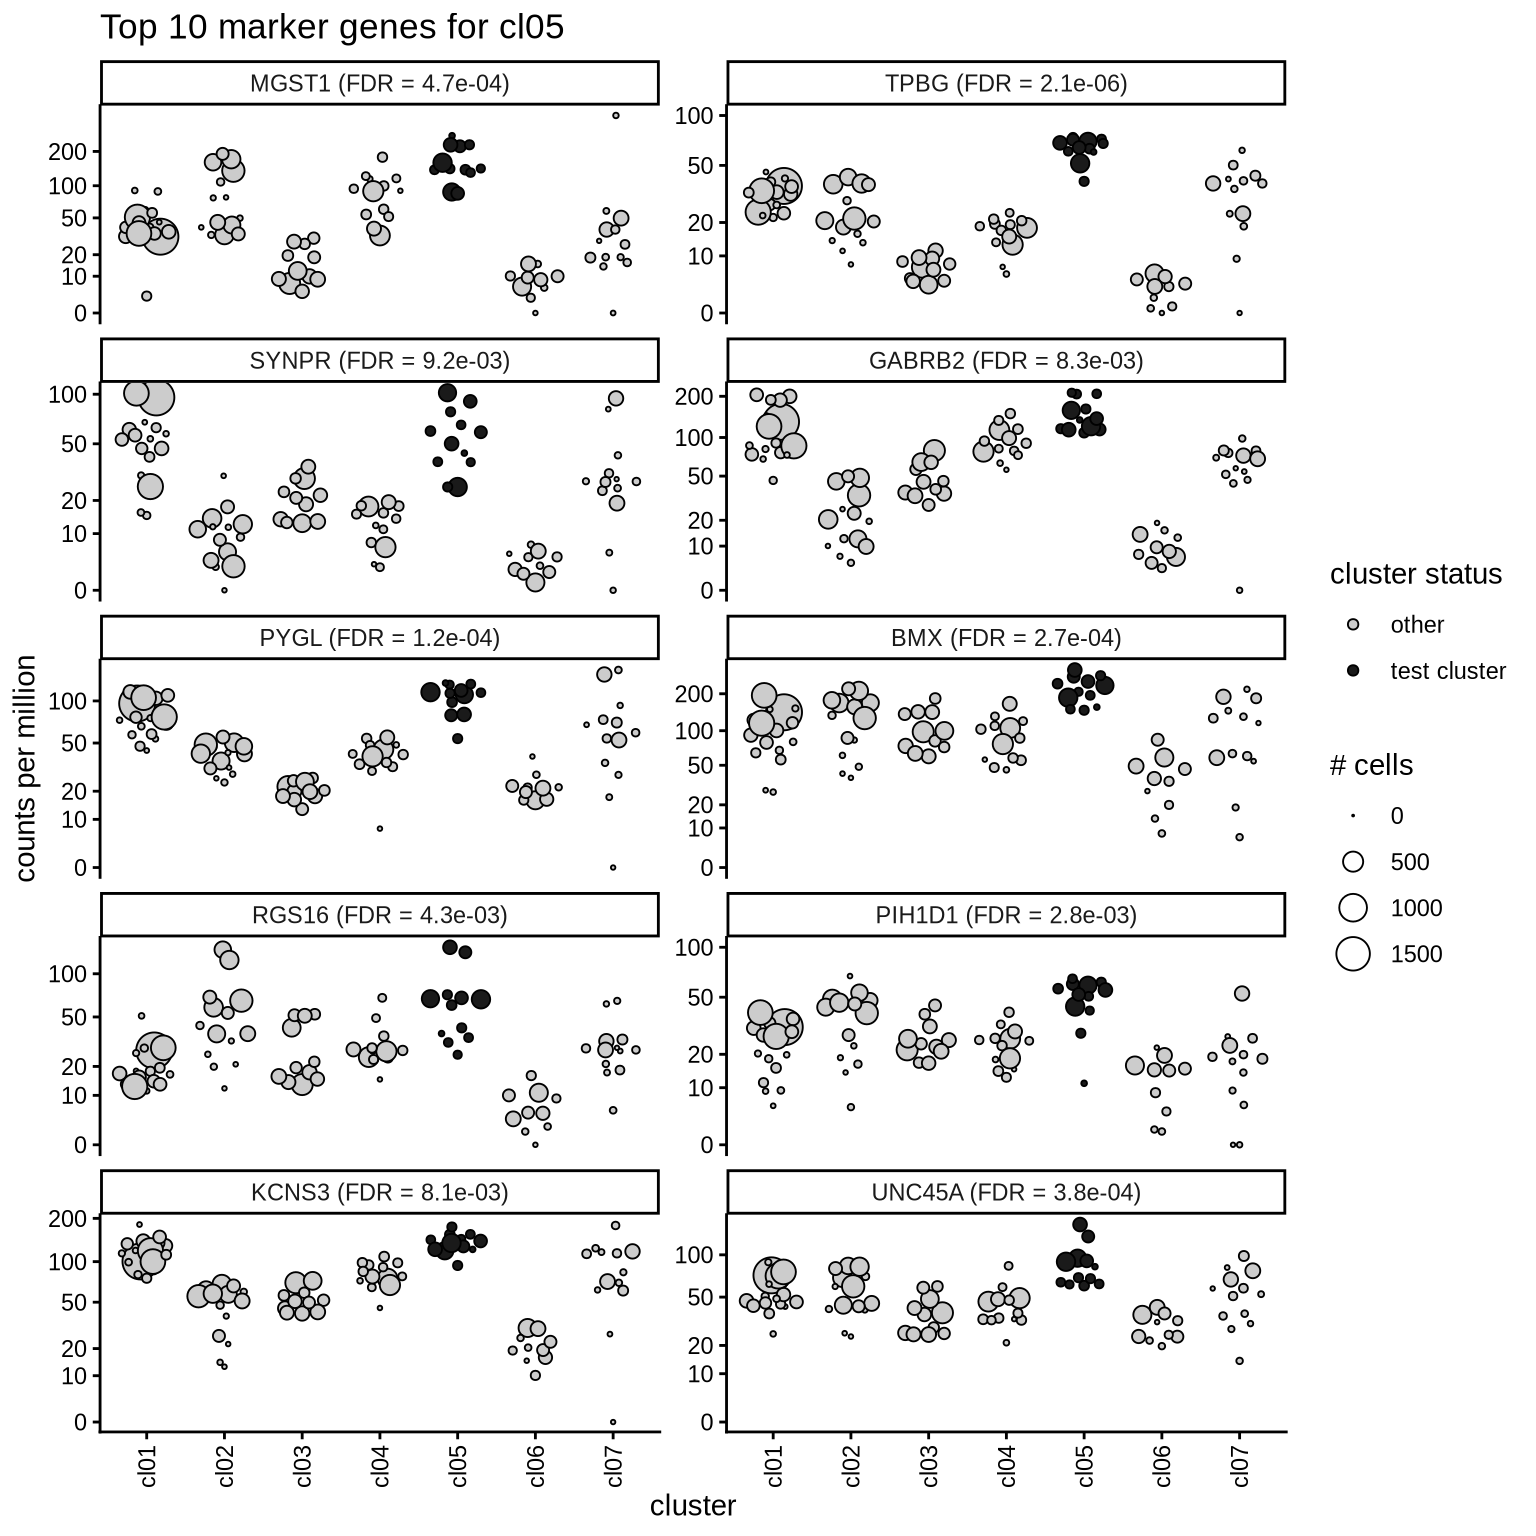
cl06
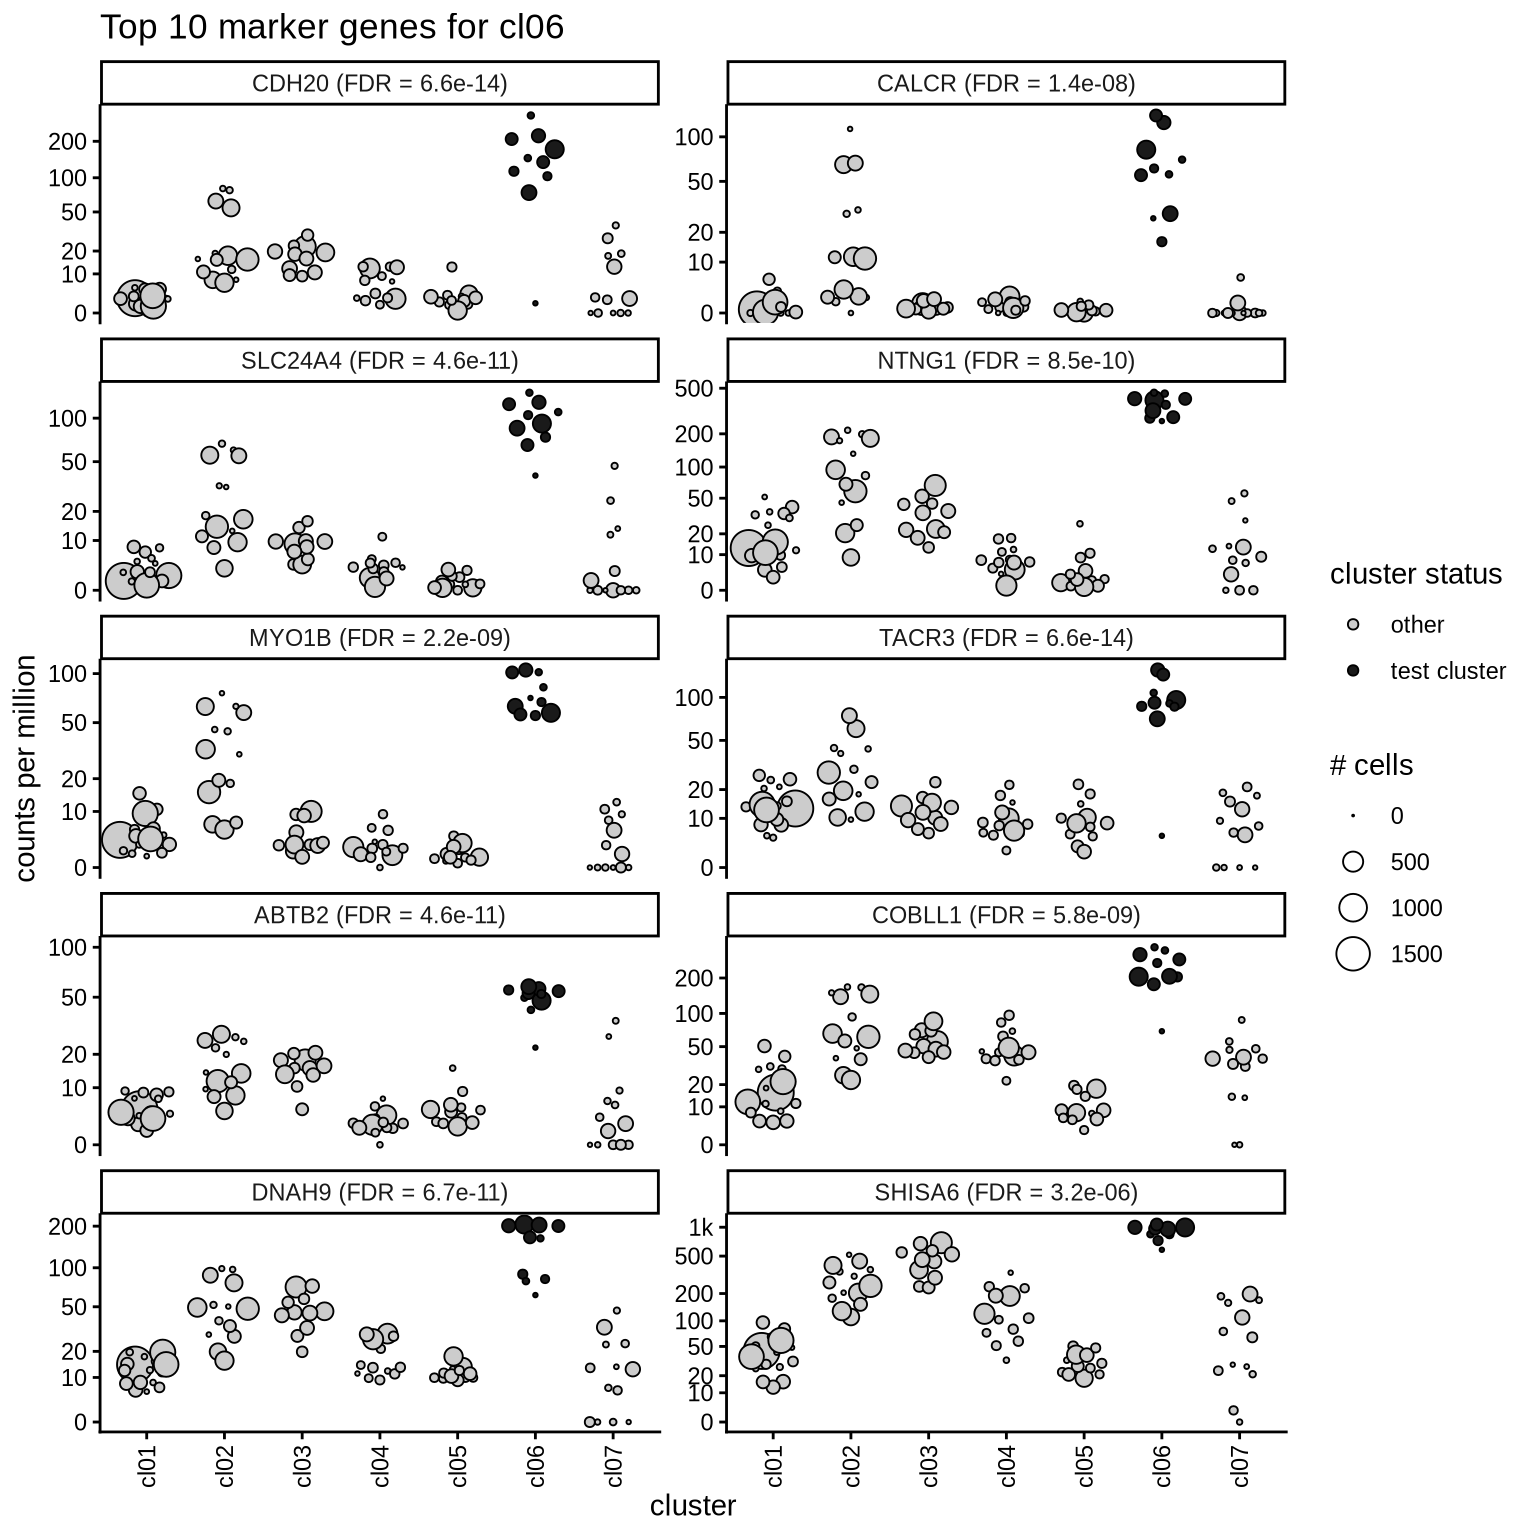
cl07
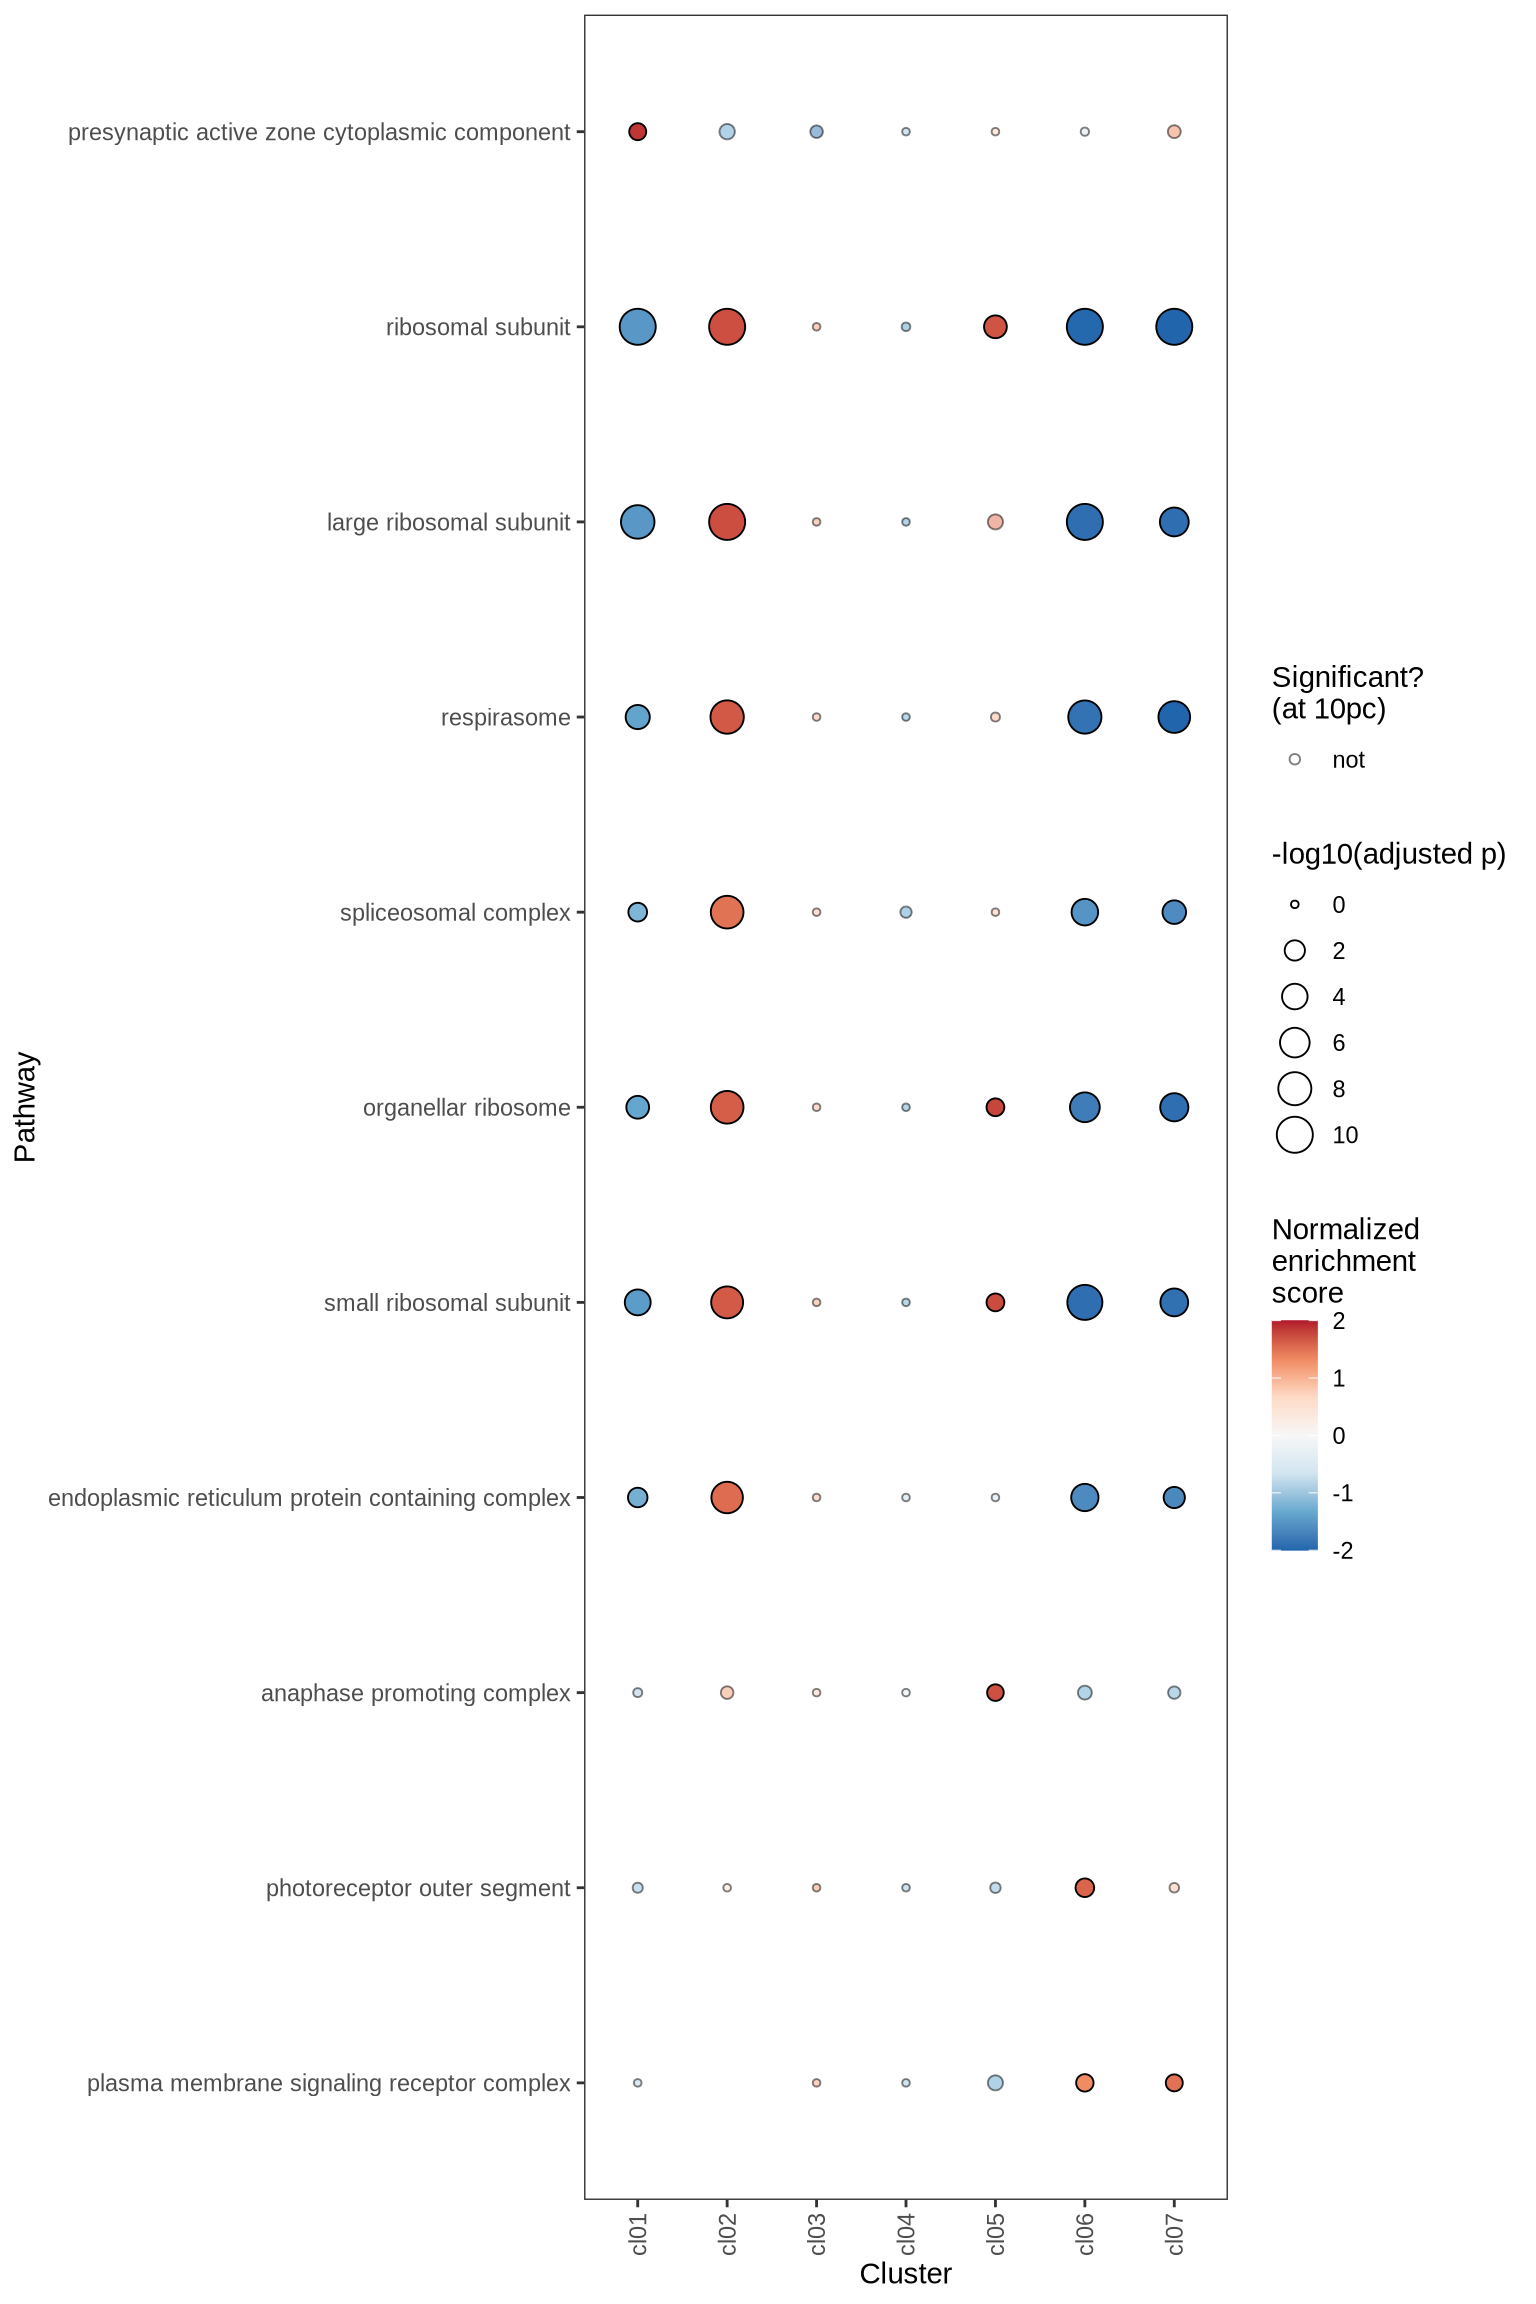
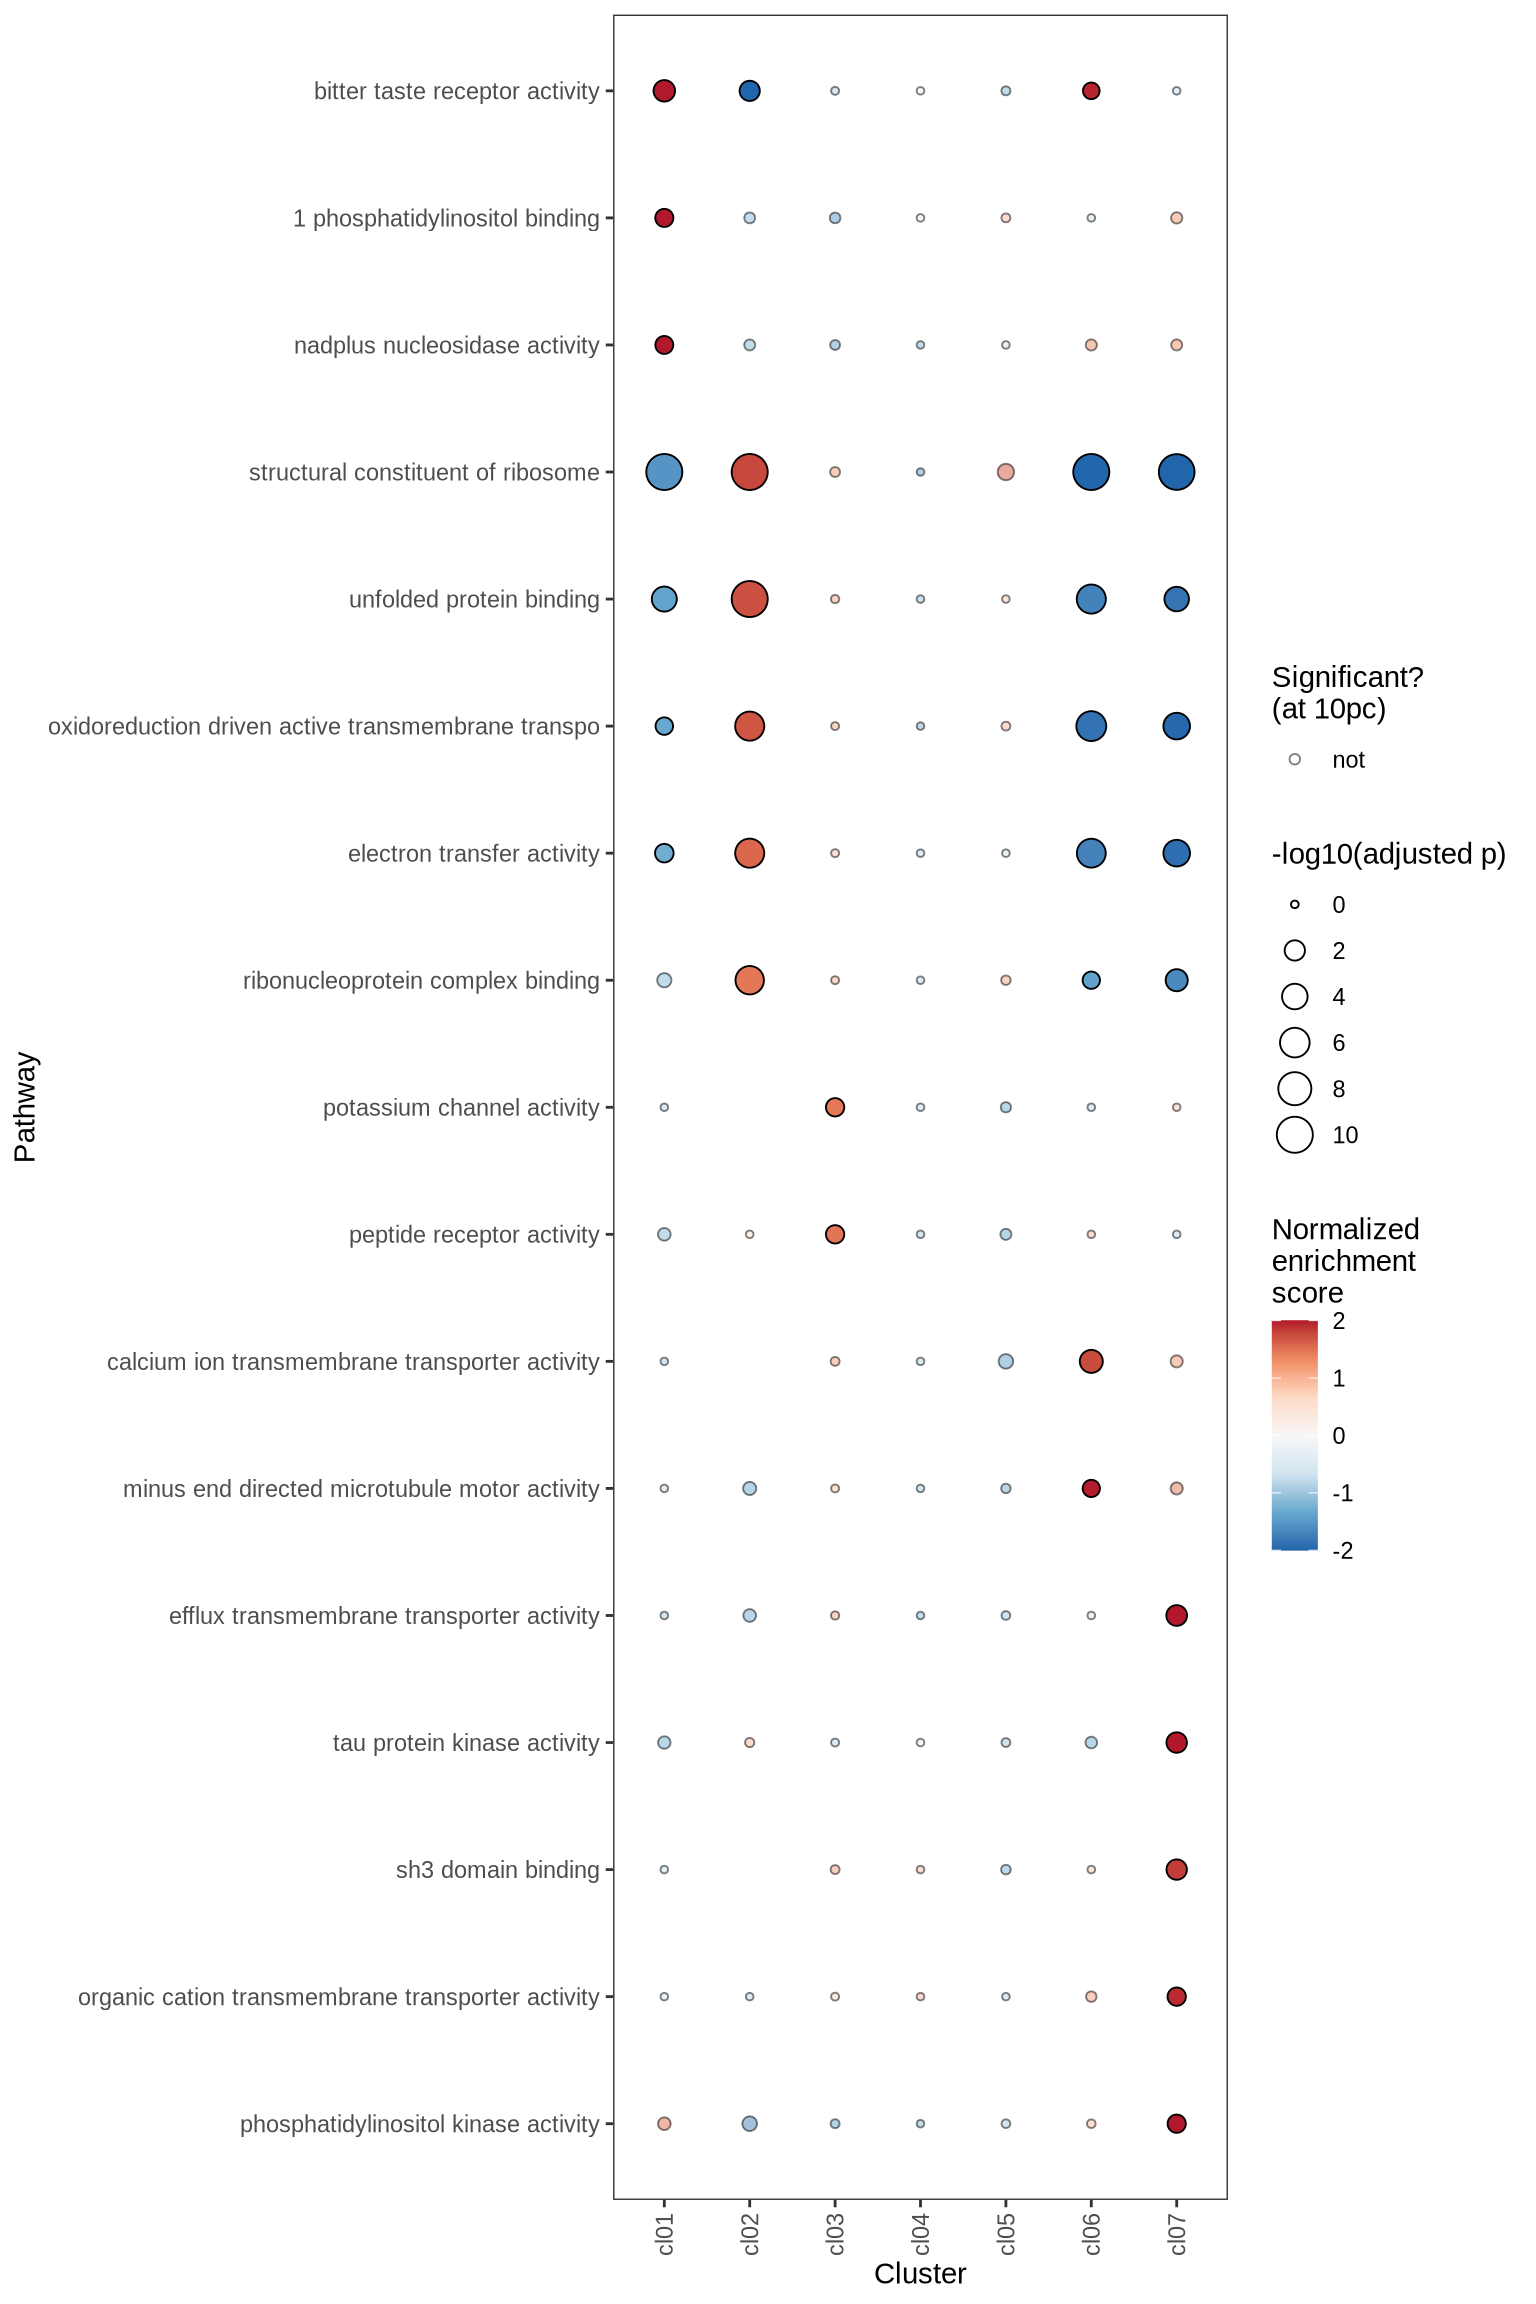
GSEA characterisation of clusters
Gene Set Enrichment Analysis (GSEA) was performed on marker genes for each cluster, using log fold change as the ranking variable. The top 10 pathways, grouped into five categories and selected based on a significance threshold of 0.05, are displayed for each cluster.
for (p in names(gsea_ls)) {
  if (is.null(gsea_ls[[p]]))
    next
  cat('#### ', p, '\n')
  dt    = gsea_ls[[p]] %>% .[ gsea_var == gsea_var_sel ]
  plot_gsea_dotplot(dt, gsea_cut = gsea_cut, n_top_paths = 5, max_nes = 2,
    size_range = c(10, 200), what = "pos_only", cl_order = cl_ord) %>% print
  cat('\n\n')
}
go_bp
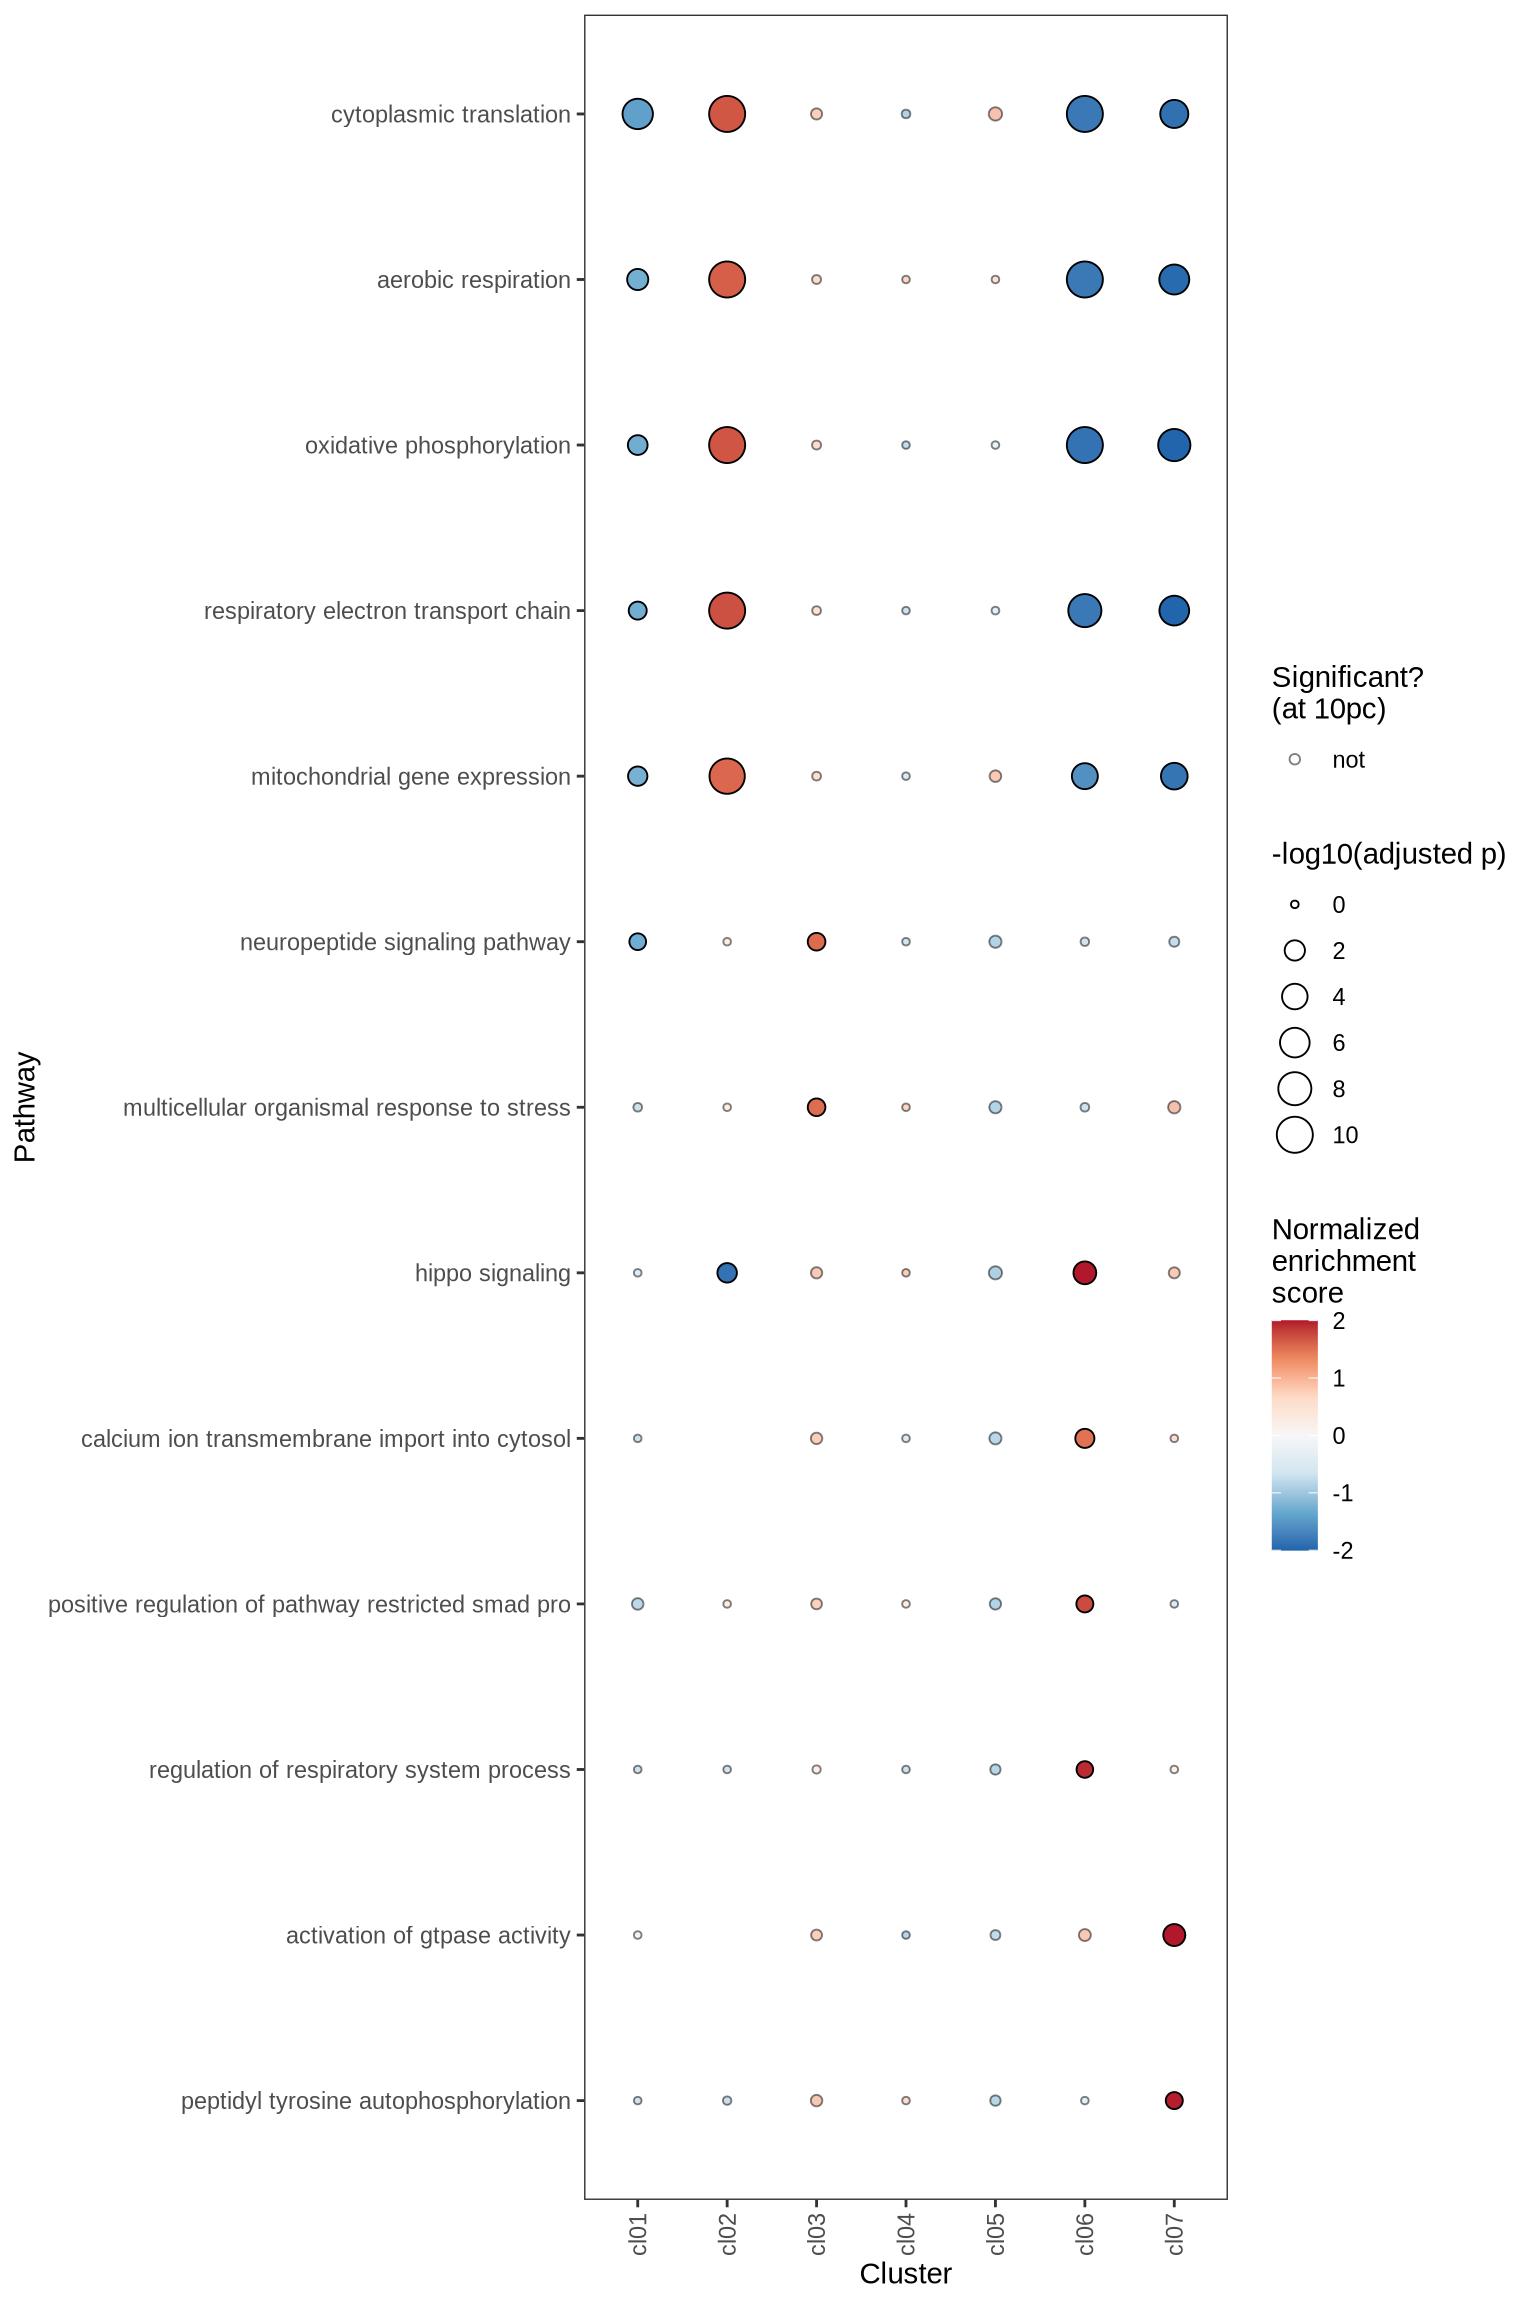
go_cc
go_mf
R session info
Details of the R package versions used are given below.
devtools::session_info()## ─ Session info ───────────────────────────────────────────────────────────────
## setting value
## version R version 4.4.3 (2025-02-28)
## os Red Hat Enterprise Linux 8.10 (Ootpa)
## system x86_64, linux-gnu
## ui X11
## language (EN)
## collate en_US.UTF-8
## ctype en_US.UTF-8
## tz Europe/Zurich
## date 2026-03-25
## pandoc 3.8.2.1 @ /home/macnairw/packages/scprocess/.snakemake/conda/4fef11cadd34f9d2d13a0d6139d09340_/bin/ (via rmarkdown)
## quarto NA
##
## ─ Packages ───────────────────────────────────────────────────────────────────
## package * version date (UTC) lib source
## abind 1.4-8 2024-09-12 [1] CRAN (R 4.4.3)
## assertthat * 0.2.1 2019-03-21 [1] CRAN (R 4.4.3)
## basilisk 1.18.0 2024-10-29 [1] Bioconductor 3.20 (R 4.4.2)
## basilisk.utils 1.18.0 2024-10-29 [1] Bioconductor 3.20 (R 4.4.2)
## beachmat 2.22.0 2024-10-29 [1] Bioconductor 3.20 (R 4.4.3)
## beeswarm 0.4.0 2021-06-01 [1] CRAN (R 4.4.3)
## Biobase * 2.66.0 2024-10-29 [1] Bioconductor 3.20 (R 4.4.2)
## BiocGenerics * 0.52.0 2024-10-29 [1] Bioconductor 3.20 (R 4.4.2)
## BiocManager 1.30.27 2025-11-14 [1] CRAN (R 4.4.3)
## BiocNeighbors 2.0.0 2024-10-29 [1] Bioconductor 3.20 (R 4.4.3)
## BiocParallel * 1.40.0 2024-10-29 [1] Bioconductor 3.20 (R 4.4.2)
## BiocSingular 1.22.0 2024-10-29 [1] Bioconductor 3.20 (R 4.4.3)
## BiocStyle * 2.34.0 2024-10-29 [1] Bioconductor 3.20 (R 4.4.2)
## bluster 1.16.0 2024-10-29 [1] Bioconductor 3.20 (R 4.4.3)
## bookdown 0.45 2025-10-03 [1] CRAN (R 4.4.3)
## bslib 0.9.0 2025-01-30 [1] CRAN (R 4.4.3)
## ca 0.71.1 2020-01-24 [1] CRAN (R 4.4.3)
## cachem 1.1.0 2024-05-16 [1] CRAN (R 4.4.3)
## Cairo 1.7-0 2025-10-29 [1] CRAN (R 4.4.3)
## callr 3.7.6 2024-03-25 [1] CRAN (R 4.4.3)
## cellranger 1.1.0 2016-07-27 [1] CRAN (R 4.4.3)
## circlize * 0.4.16 2024-02-20 [1] CRAN (R 4.4.3)
## cli 3.6.5 2025-04-23 [1] CRAN (R 4.4.3)
## clue 0.3-66 2024-11-13 [1] CRAN (R 4.4.3)
## cluster 2.1.8.1 2025-03-12 [1] CRAN (R 4.4.3)
## codetools 0.2-20 2024-03-31 [1] CRAN (R 4.4.3)
## colorspace 2.1-2 2025-09-22 [1] CRAN (R 4.4.3)
## ComplexHeatmap * 2.22.0 2024-10-29 [1] Bioconductor 3.20 (R 4.4.2)
## cowplot 1.2.0 2025-07-07 [1] CRAN (R 4.4.3)
## crayon 1.5.3 2024-06-20 [1] CRAN (R 4.4.3)
## data.table * 1.17.8 2025-07-10 [1] CRAN (R 4.4.3)
## DelayedArray 0.32.0 2024-10-29 [1] Bioconductor 3.20 (R 4.4.2)
## deldir 2.0-4 2024-02-28 [1] CRAN (R 4.4.3)
## DESeq2 * 1.46.0 2024-10-29 [1] Bioconductor 3.20 (R 4.4.3)
## devtools 2.4.6 2025-10-03 [1] CRAN (R 4.4.3)
## digest 0.6.39 2025-11-19 [1] CRAN (R 4.4.3)
## dir.expiry 1.14.0 2024-10-29 [1] Bioconductor 3.20 (R 4.4.2)
## doParallel 1.0.17 2022-02-07 [1] CRAN (R 4.4.3)
## dotCall64 1.2 2024-10-04 [1] CRAN (R 4.4.3)
## dplyr 1.1.4 2023-11-17 [1] CRAN (R 4.4.3)
## dqrng 0.3.2 2023-11-29 [1] CRAN (R 4.4.3)
## edgeR * 4.4.0 2024-10-29 [1] Bioconductor 3.20 (R 4.4.2)
## ellipsis 0.3.2 2021-04-29 [1] CRAN (R 4.4.3)
## evaluate 1.0.5 2025-08-27 [1] CRAN (R 4.4.3)
## farver 2.1.2 2024-05-13 [1] CRAN (R 4.4.3)
## fastDummies 1.7.5 2025-01-20 [1] CRAN (R 4.4.3)
## fastmap 1.2.0 2024-05-15 [1] CRAN (R 4.4.3)
## fastmatch 1.1-6 2024-12-23 [1] CRAN (R 4.4.3)
## fgsea * 1.32.2 2024-12-19 [1] Bioconductor 3.20 (R 4.4.2)
## filelock 1.0.3 2023-12-11 [1] CRAN (R 4.4.3)
## fitdistrplus 1.2-4 2025-07-03 [1] CRAN (R 4.4.3)
## forcats * 1.0.1 2025-09-25 [1] CRAN (R 4.4.3)
## foreach 1.5.2 2022-02-02 [1] CRAN (R 4.4.3)
## fs 1.6.6 2025-04-12 [1] CRAN (R 4.4.3)
## future * 1.68.0 2025-11-17 [1] CRAN (R 4.4.3)
## future.apply 1.20.0 2025-06-06 [1] CRAN (R 4.4.3)
## generics 0.1.4 2025-05-09 [1] CRAN (R 4.4.3)
## GenomeInfoDb * 1.42.0 2024-10-29 [1] Bioconductor 3.20 (R 4.4.2)
## GenomeInfoDbData 1.2.13 2026-03-05 [1] Bioconductor
## GenomicRanges * 1.58.0 2024-10-29 [1] Bioconductor 3.20 (R 4.4.2)
## GetoptLong 1.0.5 2020-12-15 [1] CRAN (R 4.4.3)
## getPass 0.2-4 2023-12-10 [1] CRAN (R 4.4.3)
## ggbeeswarm * 0.7.2 2023-04-29 [1] CRAN (R 4.4.3)
## ggh4x * 0.3.1 2025-05-30 [1] CRAN (R 4.4.3)
## ggplot.multistats * 1.0.1 2024-09-25 [1] CRAN (R 4.4.3)
## ggplot2 * 4.0.1 2025-11-14 [1] CRAN (R 4.4.3)
## ggrepel * 0.9.6 2024-09-07 [1] CRAN (R 4.4.3)
## ggridges 0.5.7 2025-08-27 [1] CRAN (R 4.4.3)
## git2r 0.35.0 2024-10-20 [1] CRAN (R 4.4.3)
## GlobalOptions 0.1.2 2020-06-10 [1] CRAN (R 4.4.3)
## globals 0.18.0 2025-05-08 [1] CRAN (R 4.4.3)
## glue 1.8.0 2024-09-30 [1] CRAN (R 4.4.3)
## goftest 1.2-3 2021-10-07 [1] CRAN (R 4.4.3)
## gridExtra 2.3 2017-09-09 [1] CRAN (R 4.4.3)
## gtable 0.3.6 2024-10-25 [1] CRAN (R 4.4.3)
## harmony * 1.2.4 2025-10-10 [1] CRAN (R 4.4.3)
## hexbin 1.28.5 2024-11-13 [1] CRAN (R 4.4.3)
## htmltools 0.5.8.1 2024-04-04 [1] CRAN (R 4.4.3)
## htmlwidgets 1.6.4 2023-12-06 [1] CRAN (R 4.4.3)
## httpuv 1.6.16 2025-04-16 [1] CRAN (R 4.4.3)
## httr 1.4.7 2023-08-15 [1] CRAN (R 4.4.3)
## ica 1.0-3 2022-07-08 [1] CRAN (R 4.4.3)
## igraph 2.1.4 2025-01-23 [1] CRAN (R 4.4.3)
## IRanges * 2.40.0 2024-10-29 [1] Bioconductor 3.20 (R 4.4.2)
## irlba 2.3.5.1 2022-10-03 [1] CRAN (R 4.4.3)
## iterators 1.0.14 2022-02-05 [1] CRAN (R 4.4.3)
## jquerylib 0.1.4 2021-04-26 [1] CRAN (R 4.4.3)
## jsonlite 2.0.0 2025-03-27 [1] CRAN (R 4.4.3)
## KernSmooth 2.23-26 2025-01-01 [1] CRAN (R 4.4.3)
## knitr 1.50 2025-03-16 [1] CRAN (R 4.4.3)
## labeling 0.4.3 2023-08-29 [1] CRAN (R 4.4.3)
## later 1.4.4 2025-08-27 [1] CRAN (R 4.4.3)
## lattice 0.22-7 2025-04-02 [1] CRAN (R 4.4.3)
## lazyeval 0.2.2 2019-03-15 [1] CRAN (R 4.4.3)
## lifecycle 1.0.4 2023-11-07 [1] CRAN (R 4.4.3)
## limma * 3.62.1 2024-11-03 [1] Bioconductor 3.20 (R 4.4.2)
## listenv 0.10.0 2025-11-02 [1] CRAN (R 4.4.3)
## lmtest 0.9-40 2022-03-21 [1] CRAN (R 4.4.3)
## locfit 1.5-9.12 2025-03-05 [1] CRAN (R 4.4.3)
## magrittr * 2.0.4 2025-09-12 [1] CRAN (R 4.4.3)
## MASS 7.3-65 2025-02-28 [1] CRAN (R 4.4.3)
## Matrix * 1.7-4 2025-08-28 [1] CRAN (R 4.4.3)
## MatrixGenerics * 1.18.0 2024-10-29 [1] Bioconductor 3.20 (R 4.4.2)
## matrixStats * 1.5.0 2025-01-07 [1] CRAN (R 4.4.3)
## memoise 2.0.1 2021-11-26 [1] CRAN (R 4.4.3)
## metapod 1.14.0 2024-10-29 [1] Bioconductor 3.20 (R 4.4.3)
## MetBrewer 0.2.0 2022-03-21 [1] CRAN (R 4.4.3)
## mgcv 1.9-4 2025-11-07 [1] CRAN (R 4.4.3)
## mime 0.13 2025-03-17 [1] CRAN (R 4.4.3)
## miniUI 0.1.2 2025-04-17 [1] CRAN (R 4.4.3)
## nlme 3.1-168 2025-03-31 [1] CRAN (R 4.4.3)
## otel 0.2.0 2025-08-29 [1] CRAN (R 4.4.3)
## parallelly 1.45.1 2025-07-24 [1] CRAN (R 4.4.3)
## patchwork * 1.3.2 2025-08-25 [1] CRAN (R 4.4.3)
## pbapply 1.7-4 2025-07-20 [1] CRAN (R 4.4.3)
## pillar 1.11.1 2025-09-17 [1] CRAN (R 4.4.3)
## pkgbuild 1.4.8 2025-05-26 [1] CRAN (R 4.4.3)
## pkgconfig 2.0.3 2019-09-22 [1] CRAN (R 4.4.3)
## pkgload 1.4.1 2025-09-23 [1] CRAN (R 4.4.3)
## plotly 4.11.0 2025-06-19 [1] CRAN (R 4.4.3)
## plyr 1.8.9 2023-10-02 [1] CRAN (R 4.4.3)
## png 0.1-8 2022-11-29 [1] CRAN (R 4.4.3)
## polyclip 1.10-7 2024-07-23 [1] CRAN (R 4.4.3)
## processx 3.8.6 2025-02-21 [1] CRAN (R 4.4.3)
## progressr 0.18.0 2025-11-06 [1] CRAN (R 4.4.3)
## promises 1.5.0 2025-11-01 [1] CRAN (R 4.4.3)
## ps 1.9.1 2025-04-12 [1] CRAN (R 4.4.3)
## purrr 1.2.0 2025-11-04 [1] CRAN (R 4.4.3)
## R.methodsS3 1.8.2 2022-06-13 [1] CRAN (R 4.4.3)
## R.oo 1.27.1 2025-05-02 [1] CRAN (R 4.4.3)
## R.utils 2.13.0 2025-02-24 [1] CRAN (R 4.4.3)
## R6 2.6.1 2025-02-15 [1] CRAN (R 4.4.3)
## RANN 2.6.2 2024-08-25 [1] CRAN (R 4.4.3)
## RColorBrewer * 1.1-3 2022-04-03 [1] CRAN (R 4.4.3)
## Rcpp * 1.1.0 2025-07-02 [1] CRAN (R 4.4.3)
## RcppAnnoy 0.0.22 2024-01-23 [1] CRAN (R 4.4.3)
## RcppHNSW 0.6.0 2024-02-04 [1] CRAN (R 4.4.3)
## readxl * 1.4.5 2025-03-07 [1] CRAN (R 4.4.3)
## registry 0.5-1 2019-03-05 [1] CRAN (R 4.4.3)
## remotes 2.5.0 2024-03-17 [1] CRAN (R 4.4.3)
## reshape2 1.4.5 2025-11-12 [1] CRAN (R 4.4.3)
## reticulate 1.44.1 2025-11-14 [1] CRAN (R 4.4.3)
## rhdf5 * 2.50.0 2024-10-29 [1] Bioconductor 3.20 (R 4.4.3)
## rhdf5filters 1.18.0 2024-10-29 [1] Bioconductor 3.20 (R 4.4.3)
## Rhdf5lib 1.28.0 2024-10-29 [1] Bioconductor 3.20 (R 4.4.2)
## RhpcBLASctl 0.23-42 2023-02-11 [1] CRAN (R 4.4.3)
## rjson 0.2.23 2024-09-16 [1] CRAN (R 4.4.3)
## rlang 1.1.6 2025-04-11 [1] CRAN (R 4.4.3)
## rmarkdown 2.30 2025-09-28 [1] CRAN (R 4.4.3)
## rmdformats 1.0.4 2022-05-17 [1] CRAN (R 4.4.3)
## ROCR 1.0-11 2020-05-02 [1] CRAN (R 4.4.3)
## rprojroot 2.1.1 2025-08-26 [1] CRAN (R 4.4.3)
## RSpectra 0.16-2 2024-07-18 [1] CRAN (R 4.4.3)
## rstudioapi 0.17.1 2024-10-22 [1] CRAN (R 4.4.3)
## rsvd 1.0.5 2021-04-16 [1] CRAN (R 4.4.1)
## Rtsne 0.17 2023-12-07 [1] CRAN (R 4.4.3)
## S4Arrays 1.6.0 2024-10-29 [1] Bioconductor 3.20 (R 4.4.3)
## S4Vectors * 0.44.0 2024-10-29 [1] Bioconductor 3.20 (R 4.4.2)
## S7 0.2.1 2025-11-14 [1] CRAN (R 4.4.3)
## sass 0.4.10 2025-04-11 [1] CRAN (R 4.4.3)
## ScaledMatrix 1.14.0 2024-10-29 [1] Bioconductor 3.20 (R 4.4.2)
## scales * 1.4.0 2025-04-24 [1] CRAN (R 4.4.3)
## scater * 1.34.1 2025-03-03 [1] Bioconductor 3.20 (R 4.4.2)
## scattermore 1.2 2023-06-12 [1] CRAN (R 4.4.3)
## scran * 1.34.0 2024-10-29 [1] Bioconductor 3.20 (R 4.4.3)
## sctransform 0.4.2 2025-04-30 [1] CRAN (R 4.4.3)
## scuttle * 1.16.0 2024-10-29 [1] Bioconductor 3.20 (R 4.4.3)
## seriation * 1.5.8 2025-08-20 [1] CRAN (R 4.4.3)
## sessioninfo 1.2.3 2025-02-05 [1] CRAN (R 4.4.3)
## Seurat * 5.3.1 2025-10-29 [1] CRAN (R 4.4.3)
## SeuratObject * 5.2.0 2025-08-27 [1] CRAN (R 4.4.3)
## shape 1.4.6.1 2024-02-23 [1] CRAN (R 4.4.3)
## shiny 1.11.1 2025-07-03 [1] CRAN (R 4.4.3)
## SingleCellExperiment * 1.28.0 2024-10-29 [1] Bioconductor 3.20 (R 4.4.2)
## sp * 2.2-0 2025-02-01 [1] CRAN (R 4.4.3)
## spam 2.11-1 2025-01-20 [1] CRAN (R 4.4.3)
## SparseArray 1.6.0 2024-10-29 [1] Bioconductor 3.20 (R 4.4.3)
## spatstat.data 3.1-9 2025-10-18 [1] CRAN (R 4.4.3)
## spatstat.explore 3.6-0 2025-11-22 [1] CRAN (R 4.4.3)
## spatstat.geom 3.6-1 2025-11-20 [1] CRAN (R 4.4.3)
## spatstat.random 3.4-3 2025-11-21 [1] CRAN (R 4.4.3)
## spatstat.sparse 3.1-0 2024-06-21 [1] CRAN (R 4.4.3)
## spatstat.univar 3.1-5 2025-11-17 [1] CRAN (R 4.4.3)
## spatstat.utils 3.2-0 2025-09-20 [1] CRAN (R 4.4.3)
## statmod 1.5.1 2025-10-09 [1] CRAN (R 4.4.3)
## strex * 2.0.1 2024-10-03 [1] CRAN (R 4.4.3)
## stringi * 1.8.7 2025-03-27 [1] CRAN (R 4.4.3)
## stringr * 1.6.0 2025-11-04 [1] CRAN (R 4.4.3)
## SummarizedExperiment * 1.36.0 2024-10-29 [1] Bioconductor 3.20 (R 4.4.2)
## survival 3.8-3 2024-12-17 [1] CRAN (R 4.4.3)
## tensor 1.5.1 2025-06-17 [1] CRAN (R 4.4.3)
## tibble 3.3.0 2025-06-08 [1] CRAN (R 4.4.3)
## tidyr 1.3.1 2024-01-24 [1] CRAN (R 4.4.3)
## tidyselect 1.2.1 2024-03-11 [1] CRAN (R 4.4.3)
## TSP 1.2.6 2025-11-27 [1] CRAN (R 4.4.3)
## UCSC.utils 1.2.0 2024-10-29 [1] Bioconductor 3.20 (R 4.4.2)
## usethis 3.2.1 2025-09-06 [1] CRAN (R 4.4.3)
## uwot * 0.2.4 2025-11-10 [1] CRAN (R 4.4.3)
## vctrs 0.6.5 2023-12-01 [1] CRAN (R 4.4.3)
## vipor 0.4.7 2023-12-18 [1] CRAN (R 4.4.3)
## viridis * 0.6.5 2024-01-29 [1] CRAN (R 4.4.3)
## viridisLite * 0.4.2 2023-05-02 [1] CRAN (R 4.4.3)
## whisker 0.4.1 2022-12-05 [1] CRAN (R 4.4.3)
## withr 3.0.2 2024-10-28 [1] CRAN (R 4.4.3)
## workflowr * 1.7.2 2025-08-18 [1] CRAN (R 4.4.3)
## xfun 0.54 2025-10-30 [1] CRAN (R 4.4.3)
## xtable 1.8-4 2019-04-21 [1] CRAN (R 4.4.3)
## XVector 0.46.0 2024-10-29 [1] Bioconductor 3.20 (R 4.4.2)
## yaml 2.3.11 2025-11-28 [1] CRAN (R 4.4.3)
## zellkonverter * 1.16.0 2024-10-29 [1] Bioconductor 3.20 (R 4.4.2)
## zlibbioc 1.52.0 2024-10-29 [1] Bioconductor 3.20 (R 4.4.2)
## zoo 1.8-14 2025-04-10 [1] CRAN (R 4.4.3)
##
## [1] /home/macnairw/packages/scprocess/.snakemake/conda/4fef11cadd34f9d2d13a0d6139d09340_/lib/R/library
## * ── Packages attached to the search path.
##
## ──────────────────────────────────────────────────────────────────────────────